

The XAU Index is great for assessing what’s really happening in the precious metals market.
 Bullion.Directory precious metals analysis 14 April, 2023
By Przemysław K. Radomski
Founder of GoldPriceForecast.com
One of the most important (and one that we have the longest dataset for) indices present on the precious metals market is the XAU Index. The index has been around for a long time, and it’s a proxy for both gold stocks and silver stocks.
Let’s take a look at the XAU Index chart, as this is where I see one of the key developments that happened this month.

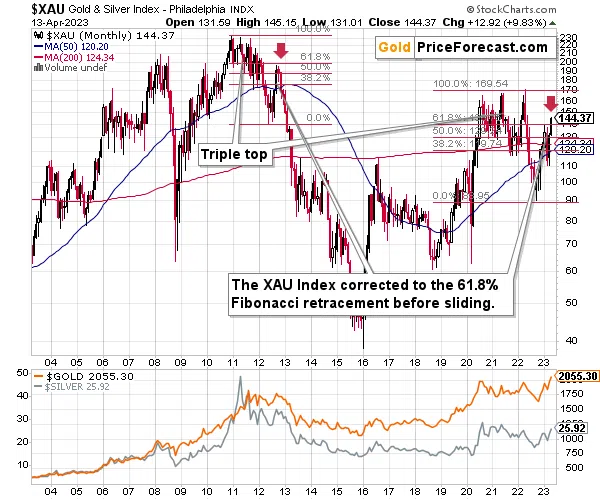
How high did the XAU Index correct in a sharp manner back in 2021 before sliding from above 200 to below 40 (eventually, and below 90 in several months)?
It corrected to more or less its 61.8% Fibonacci retracement level. And the initial slide happened after a triple-top pattern.
Interestingly, we see exactly the same thing right now. Ok, the XAU moved slightly above this level, but the above is a monthly chart, the month is far from over and given the gold-missed-PPI-expectations link, it’s very likely that the XAU will get back below its 61.8% retracement shortly.
The XAU Index first declined sharply after a triple-top pattern and now it just corrected approximately to its 61.8% Fibonacci retracement.
This is screaming long-term sell signal.
Also… Please note the obvious. The XAU Index is not only below its 2011 high. It’s not only below its 2008 high. It’s even below its 2006 high. Yes, the situation is as ridiculously bearish.
Let’s take a look at the markets from a more short-term point of view and from the U.S. perspective.
Ready to take your investment knowledge to the next level? Join our community and read the latest analyses and groundbreaking opinions from market experts. Gain exclusive access to valuable insights, engage in thought-provoking discussions, and stay on top of what’s trending in the financial markets.
On the short-term basis, it looks like the small head-and-shoulders formation is finally going to end up being a broader head-and-shoulders formation.

The red, dashed line marks the neck level of the pattern. The right shoulder is likely forming at slightly higher levels, but besides that, the pattern is quite symmetrical.
It’s now even more symmetrical than it was last week, because the late-2022 shoulder had a double top, and it seems that we’re seeing one right now as well.
While the RSI is not at 70, it is at the levels that stopped the March 2022 and the late-2022 rallies.
This, plus declining volume suggests that the turnaround is either here, or very, very near.
Consequently, we might not need to wait for another week or two before seeing a top and the subsequent decline in junior mining stocks.
In fact, we might have just seen it, or we might see it within the next couple of days.
Why is this important for gold and silver investors and traders? Because the last two big moves took place more or less in line with each other – in stocks and in precious metals (and miners). The slide in stocks could also trigger something similar in the case of commodities like crude oil. The same thing is likely to happen again this time, especially given what’s happening in the USD Index.

The USD Index is after a sharp corrective downswing that is very similar to what happened in the USDX during the 2008 corrective rally in gold.
Back then, we saw a rather broad bottom, so seeing a broad double-bottom is not a game-changer at all.
In fact, seeing a double bottom in the USD Index is quite normal. It’s also how the USDX ended its mid-2021 consolidation.
All this suggests that the USDX is ready to rally further. Most important details are present on the long-term chart, though.
Let’s zoom out.

The key thing to keep in mind is that what we see right now – along with the most recent very short-term decline – is something that we also saw in mid-2008, right before the USD Index’s sharpest rally in decades. Interestingly, we also saw it in 2011 right before gold’s top.
The preceding bottom was not a single V-shaped low, but rather a bottom that consisted of a few separate bottoms. The final short-term decline started with RSI at about 50. And guess what – the current short-term decline also started with the RSI close to 50.
Consequently, given all the other links to 2008, it seems that a big rally in the USD Index is just around the corner.
The situation in the biggest component of the USD Index: the EUR/USD exchange rate confirms the above outlook.

The RSI based on the Euro Index is practically right at the 70 level, thus flashing sell signal. These signals were very reliable in the past, especially when the Index was right after a short-term breakout.
Those breakouts were then invalidated and bigger declines followed.
This was especially the case, when we saw specific double-tops in the RSI – and we see the same pattern right now!
I marked the other similar cases with orange rectangles. These are not some immediate-term or short-term signs.
No.
Those are really strong, medium-term sell signals that already proved to be useful in the past.
The implications are very bearish for the EUR/USD, which is bullish for the USD Index.
The implications are very bearish for the precious metals sector.
Przemyslaw Radomski


Przemyslaw K. Radomski, CFA, has over twenty years of expertise in precious metals. Treating self-growth and conscious capitalism as core principles, he is the founder of GoldPriceForecast.com
As a CFA charterholder, he shares the highest standards for professional excellence and ethics for the ultimate benefit of society and believes that the greatest potential is currently in the precious metals sector. For that reason it is his main point of interest to help you make the most of that potential.
This article was originally published here
Bullion.Directory or anyone involved with Bullion.Directory will not accept any liability for loss or damage as a result of reliance on the information including data, quotes, charts and buy/sell signals contained within this website. Please be fully informed regarding the risks and costs associated with trading in precious metals. Bullion.Directory advises you to always consult with a qualified and registered specialist advisor before investing in precious metals.


Leave a Reply