

We take a look at three US Dollar charts to get a better idea of where the US Dollar price has been and where it might be headed
 Bullion.Directory precious metals analysis 7 October, 2014
By Terry Kinder
Investor, Technical Analyst
We recently looked at the price of gold in relation to the US Dollar Index (DXY). It has been useful to look at a series of US Dollar charts in relation to both gold and silver since the value of the dollar often strongly influences the price of both precious metals.
Most of these US Dollar charts have been of short or medium-term perspective. However, it can also be useful to look at the US Dollar from a longer perspective because it helps us understand where important support and resistance levels have formed and this can help us understand the current price action and patterns better.

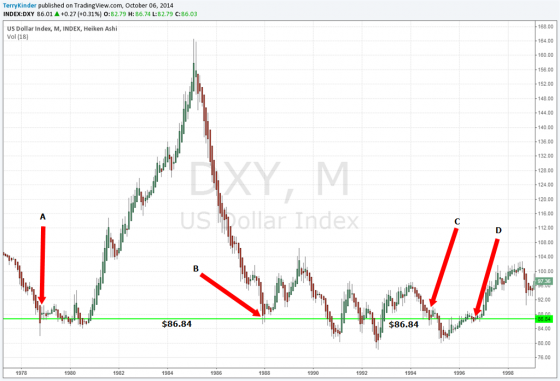
The first in our series of US Dollar Charts covers the period from 1978-1998.
Especially significant is B where the U.S. Dollar fell from over $160.00 in 1985 all the way to $85.33 in December of 1987.
Note the 4 very clear times labeled A, B, C and D where the dollar price bounced at the $86.84 level marked by the green line.
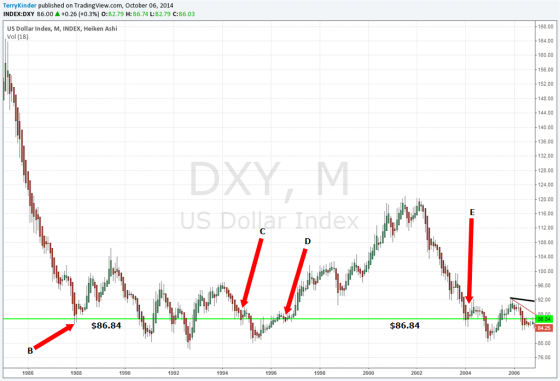
The second in our series of US Dollar Charts covers the period from 1986-2006.
On this chart there is one additional point of interest.
At point E, the dollar can be seen finding support around the same $86.84 line after a two year decline in price.
(click images to view full size charts)
The third of our US Dollar Charts covers the period from 2002 to 2014.
This chart has quite a bit going on so we will go ahead and list the points of interest:
- E – Dollar bounces near $86.84 after a two-year decline in price;
- G – Price trigger formed by Andrews’ Pitchfork and also multi-year price resistance line dating back to 2005;
- H – Price touches resistance line and falls back. In 2010 there is also another touch of this resistance line which isn’t labeled;
- I – Price moves above resistance line on this monthly chart and reaches $86.70, only $0.14 from the $86.84 level;
- J – Price trigger for smaller Andrews’ Pitchfork on right-hand side of the chart;
- K and L – Andrews’ Pitchforks. When price exited out of the top of the upper parallel channel of the larger pitchfork a second pitchfork was created.
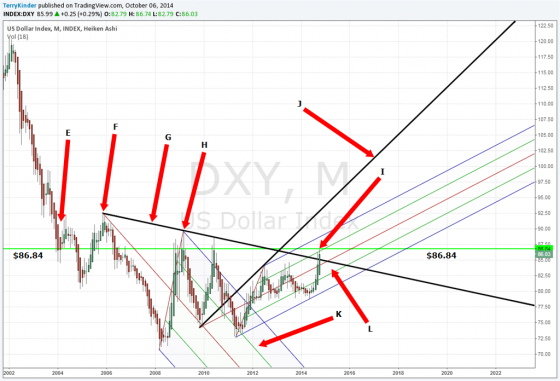
The third in our series of US Dollar Charts covers the period from 2002-2014. Of particular interest are price trigger lines G and J. Perhaps the most important thing to watch on this chart is labeled I and marks where the DXY price has both crossed above price resistance dating back to 2005 and also where the price came with $0.14 of touching resistance at $86.84.
Until it convincingly breaks through that line, any further move up in the dollar remains in doubt.
The second interesting thing is that within the pitchfork labeled L, price moved above the red median line, but then met resistance right before the $86.84 level.
If price continues to fall lower it could move back below both the red median line of the pitchfork and also below the long-term resistance line. This would be a sign of price weakness in the dollar and could be the beginning of a stronger decline.
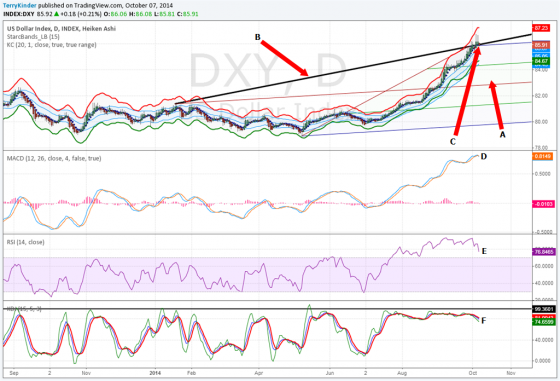
US Dollar Charts Bonus Chart: This chart is the current DXY daily chart and shows the DXY hesitating to break out at point C, as well as technical indicators beginning to roll over at points D, E, and F.
This chart includes the following important features:
- A – Andrews’ Pitchfork;
- B – Price trigger line;
- C – Price meets resistance at the trigger line and has so far failed to move convincingly above it;
- D – MACD bearish crossover;
- E – RSI is still overbought but moving lower;
- F – KDJ bearish crossover
Recent price action confirms the importance of the $86.84 level as it has posed resistance to a further move higher in the DXY.
From time to time it is good to look back in time to gain perspective on where price has been and also gain insight to where it might be headed.
Bullion.Directory or anyone involved with Bullion.Directory will not accept any liability for loss or damage as a result of reliance on the information including data, quotes, charts and buy/sell signals contained within this website. Please be fully informed regarding the risks and costs associated with trading in precious metals. Bullion.Directory advises you to always consult with a qualified and registered specialist advisor before investing in precious metals.


Leave a Reply