With the price of gold dropping from $1,346.80 in July to around $1,200.00 this month, many wonder if the price will continue to head down or will it find support and go back up.
 Bullion.Directory precious metals analysis 4 October, 2014
By Terry Kinder
Investor, Technical Analyst

The climbing US Dollar has acted to drag the price of gold lower. However, by utilizing displaced moving averages, we can project what the dollar high will be. The projected high for the DXY is $86.84. Should this prove to be the point where the dollar reverses lower, it could take some downward pressure off of the price of gold.
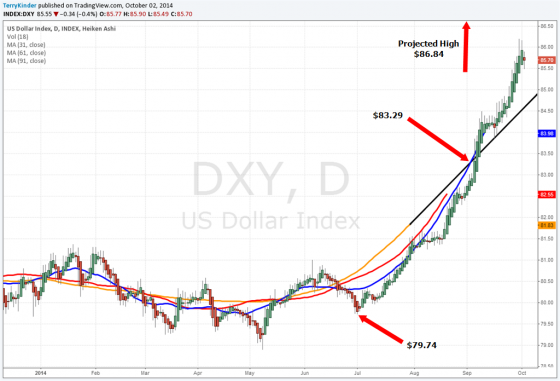
First, let’s take a look at the US Dollar by way of the US Dollar Index (DXY). The climb of the dollar has appeared to be unstoppable as it moved from a low of $78.90 in May to a close of $86.64 on October 3rd. However, using technical analysis to look at the US Dollar, there is reason to believe that it is getting a bit stretched.
The first way we can look at the DXY is through displaced moving averages. This technique is based on the work of JM Hurst as outlined in the book JM Hurst Trading Without the Rocket Math. Let’s look at the DXY daily chart above and walk through the steps to project a pivot low price for the dollar (or interim low – we can’t really know until we’re able to look back in time).
1) Place 31, 61, and 91-day simple moving averages on the chart. The averages are displaced by 16, 32, and 46 days respectively. What we’re doing is shifting each moving average to the left – the past – on the time scale;
2) Project either the 61 or the 91-day moving averages into the future. In this case we project the 91-day moving average because the 61-day is running almost parallel to the 31-day;
3) Find where the moving averages cross. On our chart of the DXY the 31-day and 91-day moving averages cross at $83.29;
4) Locate the pivot low price of the dollar which is $79.74;
5) Find the difference between where the moving averages crossed and the pivot low. In this case – $83.29 – $79.74 = $3.55;
6) To find the projected pivot high (or interim high – we can’t really know until we’re able to look back in time) we add the difference between where the moving averages crossed and the pivot low to the value of where the moving averages crossed. In this case – $83.29 + $3.55 = $86.84.
So, $86.84 is our projected pivot high (or at least interim high) for the dollar. This value is very close to the high of $86.64 made on October 3rd. Since our calculations are not exact, we should make some allowance for error. If we allow a 3-5% allowance for error, then our projected price could be as high as $89.44 – $91.18.
Another technique we can use to find possible resistance levels is Gann’s Square of Nine as outlined in How to Trade the Square of Nine With a Calculator and a Pencil. Using the methods outlined in that book we find several interesting price support and resistance levels:
1) $86.58;
2) $88.91;
3) $91.29
$86.58 is very close to both the Friday close of $86.64 and our projected pivot high of $86.84. $88.91 and $91.29 fall very close to our $89.44 – $91.18 price projections which allow for 3-5% error based on our projected $86.84 high. So, combining the numbers projected from the displaced moving averages and the Gann Square of Nine techniques, we arrive at a range of $86.84 – $91.29 for a projected pivot high (or interim high) for the dollar index. With the dollar out of the way, let’s take a look at the gold price by way of the COMEX continuous price of gold.

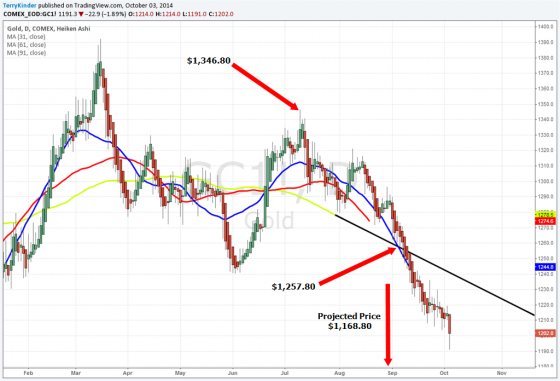
The price of gold has fallen from $1,346.80 in July to around $1,200.00 on October 3rd. Using displaced moving averages, the projected pivot low (or interim low – we can’t really know until we’re able to look back in time) for gold is $1,168.80.
With the price of gold falling as low as $1,191.00 on October 3rd, it looks poised to challenge the June 2013 “low” of $1,179.40. There is a very high probability that the $1,179.40 “low” will be taken out. Let’s walk through the steps that lead to that conclusion:
1) As with the DXY chart, we’ll be using 31-61-91 day displaced moving averages;
2) Since the 61-day moving average runs nearly parallel to the 31-day average, we project out the 91-day average;
3) Find where the moving averages cross. On our chart of the COMEX continuous price of gold the 31-day and 91-day moving averages cross at $1,257.80;
4) Locate the pivot high price of gold which is $1,346.80;
5) Find the difference between where the moving averages crossed and the pivot high. In this case – $1,346.80 – $1,257.80 = $89.00;
6) To find the projected pivot low (or interim low – we can’t really know until we’re able to look back in time) we subtract the difference between where the moving averages crossed and the pivot high from the value of where the moving averages crossed. In this case – $1,257.80 – $89.00 = $1,168.80.
So, $1,168.80 is our projected pivot low (or at least interim low) for the price of gold. This value is not too far from the $1,191.00 level reached on October 3rd. Since our calculations are not exact, we should make some allowance for error. If we allow a 3-5% allowance for error, then our projected price could be as low as $1,110.36 – $1133.74.
As in our dollar example, we’ll look at some key levels calculated on Gann’s Square of Nine. Using the Square of Nine we discover several interesting levels:
1) $1,169.56;
2) $1,135.61;
3) $1,110.47
$1,169.56 is fairly close to the $1,191.00 level hit on Friday and our projected pivot low of $1,168.80. $1,110.47 – $1,135.61 fall close to our $1,110.36 – $1,133.74 price projections which allow for 3-5% error based on our projected $1,168.80 low. So, combining the numbers projected from the displaced moving averages and the Gann Square of Nine techniques, we arrive at a range of $1,110.36 – $1,169.56 for a projected pivot low (or interim low) for the price of gold.
As mentioned in Silver Price Trend Reversal the US Dollar’s seasonal trend is normally down from now until the end of the year, so if the dollar price follows its normal trend that should take some of the downward pressure off of the price of gold.
Conclusion:
Both the price of gold to the downside and the US Dollar to the upside appear stretched. While the price of gold might fall a little more, it should find a pivot low (or interim low) between $1,169.56 on the high side and $1,110.36 on the low side.
Keep a close eye on the US Dollar Index (DXY) price. Should the dollar rise and stay above $91.29 then we will have to rethink our projections for both the DXY and the price of gold.
Bullion.Directory or anyone involved with Bullion.Directory will not accept any liability for loss or damage as a result of reliance on the information including data, quotes, charts and buy/sell signals contained within this website. Please be fully informed regarding the risks and costs associated with trading in precious metals. Bullion.Directory advises you to always consult with a qualified and registered specialist advisor before investing in precious metals.


 Material provided on the Bullion.Directory website is strictly for informational purposes only. The content is developed from sources believed to be providing accurate information. No information on this website is intended as investment, tax or legal advice and must not be relied upon as such. Please consult legal or tax professionals for specific information regarding your individual situation. Precious metals carry risk and investors requiring advice should always consult a properly qualified advisor. Bullion.Directory, it's staff or affiliates do not accept any liability for loss, damages, or loss of profit resulting from readers investment decisions.

Leave a Reply