

Is the US Dollar bull market running out of steam?
 Bullion.Directory precious metals analysis 30 September, 2014
By Terry Kinder
Investor, Technical Analyst
The US Dollar bull market when viewed on a weekly chart is starting to look a bit stretched.
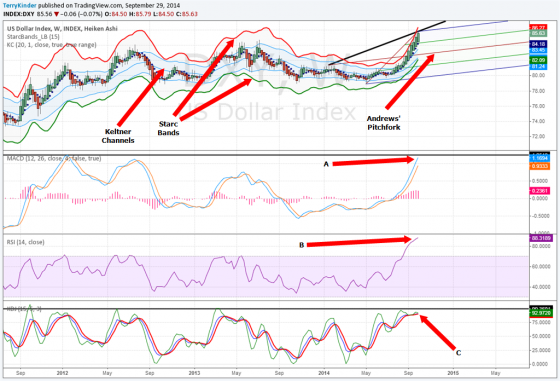
As seen in the chart above, the US Dollar bull market on the weekly chart is looking a bit stretched. A few interesting features of note on the weekly dollar chart are:
1) MACD, noted with the letter A, has moved up quite far and is near the upper range of where it has been during the post couple of years;

2) RSI, noted with the letter B, is overbought;
3) KDJ, noted with the letter C, is overbought
4) The US Dollar Index price (DXY) has climbed above the Keltner Channels, indicating very strong price momentum;
5) The Starc – (minus – green band) has crossed into the Keltner Channels, indicating strong upward price momentum;
6) DXY price near the upper parallel channel of the Andrews’ Pitchfork. Price has not yet crossed the black sell trigger line above the pitchfork.
The US Dollar bull market has some work to do, including breaking through a trend line dating back to 2005, before it climbs higher
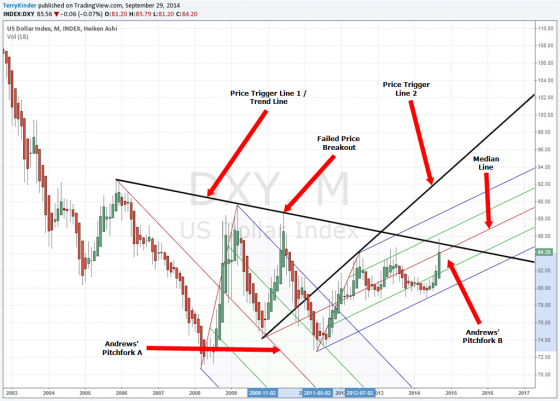
While the weekly chart showed signs of being stretched, the monthly chart of the dollar also faces some challenges before price can go higher. Some noteworthy features of the monthly dollar chart are:
1) Two Andrews’ Pitchforks. A second pitchfork, labeled B, was drawn when price failed to break through the the price trigger / trend line established by pitchfork A;
2) Andrews’ Pitchfork B was drawn after the DXY price failed to break out. The new pitchfork (B) was drawn by selecting the nearest price pivot before the failed price breakout;
3) The Price Trigger Line 1 / Trend Line dates back to 2005 and has provided resistance. If the monthly DXY price can hold above this line, then the dollar price could continue higher;
4) Price Trigger Line 2 – Should the DXY price manage to break through the upper parallel line of Andrews’ Pitchfork B, then this price trigger line would present another significant obstacle to the price moving higher.
In US Dollar Trend Looking Up, we noted:
Given the current US Dollar trend, there is a good chance it continues higher. At a minimum, it would be hard to make a case for it plunging downward out of the triangle. Some levels to watch for on the DXY:
$83.74 – $83.82 $81.47 – $81.55 On the upside, keep an eye on:
$84.92 – $85.00 $86.04 – $86.13 At this point, should the US Dollar trend reverse lower, it seems probable it would find support at the $81.47 – $81.55 level.
The US Dollar trend continues to trend higher. If this trend continues, it is likely to continue to exert downward pressure on gold and silver prices.
It looks like the $86.04 – $86.13 level is very much in play at this point and time. Should price fail at that level, it could drop down below the median line of Andrews’ Pitchfork B. This would set up for the price falling below the long-term trend line dating back to 2005. Either way, should the DXY price rise or fall, given the long-term price trend line, we should have a good idea soon which way the dollar price is headed.
For the US Dollar bull market to continue on, it will need to stay above the falling long-term trend line. Should the dollar price fall below the lower parallel line of pitchfork B, it could be a sign that upward dollar price momentum is weakening or reversing.
Bullion.Directory or anyone involved with Bullion.Directory will not accept any liability for loss or damage as a result of reliance on the information including data, quotes, charts and buy/sell signals contained within this website. Please be fully informed regarding the risks and costs associated with trading in precious metals. Bullion.Directory advises you to always consult with a qualified and registered specialist advisor before investing in precious metals.


Leave a Reply