

Gold, silver, and miners have been declining substantially recently, just as the USDX has been soaring.
 Bullion.Directory precious metals analysis 05 October, 2023
By Przemysław K. Radomski
Founder of GoldPriceForecast.com
But all (good?) things come to an end, right? While the above is up for debate, it’s definitely true that no market moves up or down in a straight line *cough* except for silver *cough* without periodic corrections.
And since the precious metals sector has been declining relentlessly recently, it seems natural to expect it to at least correct sometime in the near future.

Indeed, there are signs pointing to a nearby reversal and an upcoming correction… Before the carnage really begins.
Let’s start today’s discussion with a look at the two markets that can (and do) impact the price moves in gold, silver, and mining stocks: the USD Index and the general stock market.
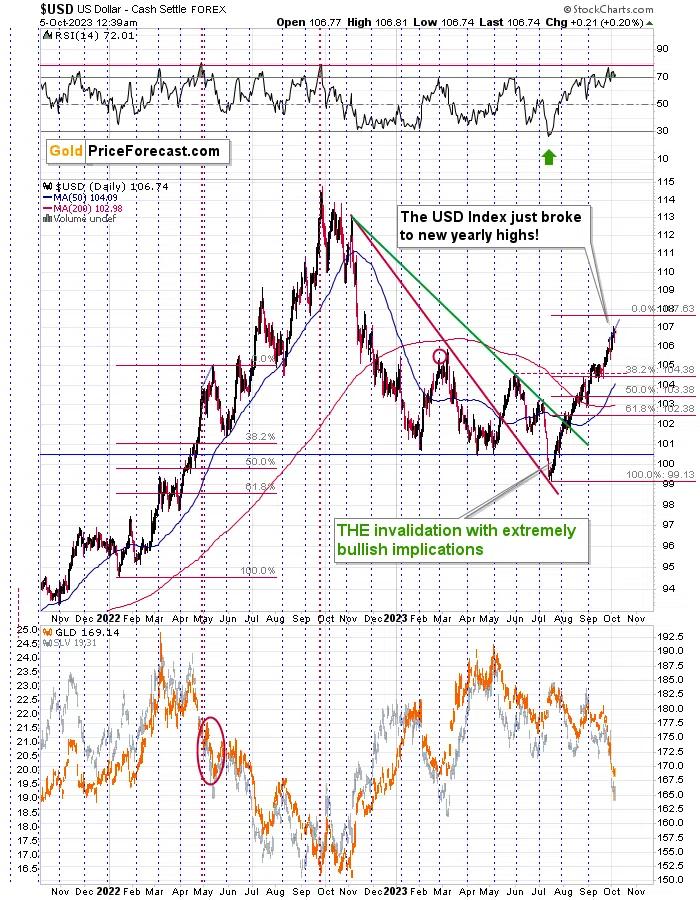
The USD Index has been truly soaring since its fake breakdown to new yearly lows. It took a breather right before and right after breaking above its May/June highs, but it moved sharply higher thereafter.
The RSI based on the U.S. Dollar index jumped well above 70, then it corrected a bit, and now it’s once again in the overbought territory. In recent history, there was only one similar situation, and that was in May 2022.
Since history tends to rhyme (just as the people’s emotional responses to similar price moves remain similar under varying economic conditions), the above situation is our best guide into the current state of affairs.
What happened then is that the USDX – after moving to the extremely overbought levels (in RSI terms), corrected slightly and then moved higher once again. That was the final short-term top. Then, a brief pullback materialized, and the rally continued.
What’s interesting is the size of the move above the initial high that was accompanied by the extreme RSI reading. I marked that move with a blue line, and I copied it to the current situation. If the USDX rallies in a similar manner here, it will top close to the 107.5 level.
This level is approximately confirmed by another technique – the Fibonacci extension. The technique suggests that a bigger move can be approximately 1.618 times bigger than the initial rally in the same move. So, it’s kind of like a Fibonacci retracement, but the other way around. Applying this technique to the current rally and using the August top as the end of the initial move provides us with ~107.6 as the target price.
The most recent high was 107.05, so it seems that the U.S. currency could move slightly higher before forming the final top. It could also be the case that it already topped, but the former seems more likely.
And you know what was the most important thing about it all from a gold investor’s point of view? That gold didn’t rally recently when the USD Index corrected a bit. This indicated that gold wasn’t ready for a rally just yet – it seems that it needs to go even lower before it can rebound.
Also, while we’re discussing the USD Index, let’s not forget how perfectly the technical technique called the cyclical turning point worked this year.

The simple and obvious (yet noticed by very few people) technique is to take into account the USD Index’s tendency to form local bottoms in the middle of the year. That’s exactly what happened this year, and it was one of the things that made me doubt the USD Index’s breakdown to new yearly lows. I wrote that this move was likely to be reversed and that the implications of that invalidation would be profound. With the USD Index well above 106, it seems that they were indeed profound.
Anyway, the key takeaway from the USD Index’s analysis for precious metals investors is that gold, silver, and mining stocks might decline a bit more before they form a short-term bottom, as they are negatively correlated with the USD Index. After all, the opposite seems to be in the cards for the latter.
How low can the USDX decline when it corrects? Of course, I can’t make any promises, but it seems that a pullback to the previous highs and the 38.2% Fibonacci retracement – at about 105 – would be a likely outcome.
Having said that, let’s see what’s going on in the stock market.

The S&P 500 Index just broke below its rising support line, and it closed there for two consecutive days. This happened right after the index verified the breakdown below the neck level of the head and shoulders pattern that I wrote about (as being potentially formed) a few weeks ago.
The best and most interesting part of all this is that both moves make much more sense together than when being examined independently. You see, the head and shoulders patterns tend to be followed by a small correction – a verification of the breakdown below the neck level.
I previously wrote that the rising medium-term support line would be likely to provide the necessary trigger for that move. That’s exactly what we saw. And now, since we’re already after this correction and this support line has been “taken out”, the natural follow-up to the head and shoulders pattern can emerge.
And the follow-up is that the decline below the neck level is likely to be approximately equal to (or bigger than) the size of the head of the pattern. I marked this technique on the above chart, and it points to a move to about 4,100.
Naturally, this doesn’t imply that the entire medium-term decline is likely to end there, but it does indicate that it’s where stocks are likely to at least take a breather and correct.
What’s the takeaway for the precious metals’ investors and traders? That the next corrective upswing might be just around the corner, but we’re not at it just yet. Also, since the stock market is more correlated with silver and miners (especially junior mining stocks) than it is with gold, the above is particularly important for those two markets.
Speaking of mining stocks, let’s take a look at their chart from the long-term point of view.

The HUI Index is a proxy for gold stocks, and the reason why I’m featuring it is that indexes are better for assessing long-term trends than ETFs – after all, the latter have fees etc. that impact their valuations in the long run and can distort the technical implications a bit.
On a side note, this effect is very (!) strong in the case of leveraged ETFs, which is why it’s not a good idea to apply technical analysis to leveraged ETFs like JNUG or JDST (to be precise, there might be some very rare exceptions).
The thing that I want to emphasize here is the fact that the HUI Index once again moved to its rising, long-term support line (marked with orange). That’s the same line that stopped the 2022 decline.
To be precise, what happened previously was that the HUI Index moved slightly below this line and then invalidated this move, which was followed by a sizable short-term rally.
I expect this line to hold once again, but this time to trigger only a small rally. And when everyone and their brother will expect gold stocks to soar, like they did in the second half of 2022, gold miners will plunge (after the small corrective upswing).
The upcoming slide is not likely to be a small thing.
No.
The current situation appears to be similar to what we saw in early 2013 (broad head and shoulders pattern marked with green, similar situation in the indicators, extreme underperformance of gold), and based on that, we can expect the corrections to be relatively small and quick and the declines to be enormous.
While we’re looking at the markets from a broader perspective, let’s take a look at the long-term proxy for junior miners – the Toronto Stock Exchange Venture Index.

What we see on the above chart might as well be the very definition of a “screaming sell signal”.
What happened recently is a sizable short-term decline. It’s not a big deal on its own.
Now, what makes it a HUGE DEAL is the fact that this move lower happened after about a yearly consolidation, a breakdown below the rising, long-term support line, and in tune with the analogy to… early 2013!
I just mentioned the same period based on a different index! The fact that we see an analogy based on two separate indexes that are both very important makes the link to early 2013 so much stronger!
The action that followed 10 years ago took many (let’s be honest – almost everyone) by surprise. This time, we’re prepared. This time, we’re ready to apply a judo-, jiu-jitsu-, or aikido-like move, and instead of being hurt, we’re taking advantage of that slide.
Still, before the massive slide materializes, it seems that we’ll see at least one corrective upswing, and it seems that it could start at prices that are just slightly lower than the current ones.
Przemyslaw Radomski


Przemyslaw K. Radomski, CFA, has over twenty years of expertise in precious metals. Treating self-growth and conscious capitalism as core principles, he is the founder of GoldPriceForecast.com
As a CFA charterholder, he shares the highest standards for professional excellence and ethics for the ultimate benefit of society and believes that the greatest potential is currently in the precious metals sector. For that reason it is his main point of interest to help you make the most of that potential.
This article was originally published here
Bullion.Directory or anyone involved with Bullion.Directory will not accept any liability for loss or damage as a result of reliance on the information including data, quotes, charts and buy/sell signals contained within this website. Please be fully informed regarding the risks and costs associated with trading in precious metals. Bullion.Directory advises you to always consult with a qualified and registered specialist advisor before investing in precious metals.


Leave a Reply