

The silver price has taken a beating lately while the US Dollar climbed to a multi-year high. But, could it be time for a silver price trend reversal?
 Bullion.Directory precious metals analysis 3 October, 2014
By Terry Kinder
Investor, Technical Analyst
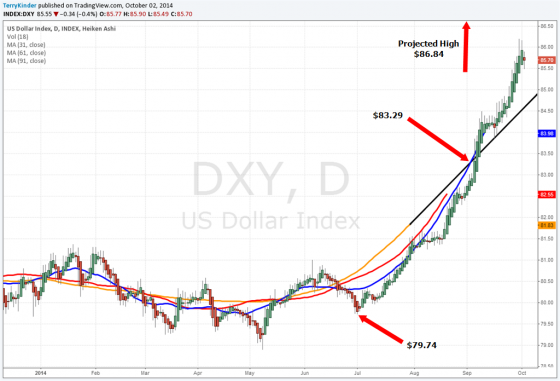
The climbing US Dollar has acted to drag the silver price lower. However, by utilizing displaced moving averages, we can project what the dollar high will be. The projected high for the DXY is $86.84. Should this prove to be the point where the dollar reverses lower, it could allow a silver price trend reversal to occur.
One obstacle blocking a silver price trend reversal has been the higher US Dollar. The dollar finally tore through the $86.04 – $86.13 resistance level and the next level, based on Gann’s Square of Nine, which might block a move higher is $88.47. Before we get too concerned about $88.47 though, let’s take a look at the above daily chart of the US Dollar Index (DXY).
In the chart, we have used 31-61-91 day displaced moving averages. This is a technique outlined in the book JM Hurst Cycle Trading Without the Rocket Math. What we have done is to take the 31, 61 and 91-day simple moving averages (SMA) and displaced them to the left on the time scale by 16, 32, and 46 days respectively. Then we project one of the moving averages, in this case the 91-day moving average, into the future. Where it crosses another moving average, in this case the 31-day, gives us a point to calculate the future price. Here is how it works:

1) Determine the pivot low – in this case it is $79.74;
2) Subtract that amount, $79.74, from the amount where the two moving averaged crossed – $83.29. The difference between $83.29 and $79.47 is $3.55;
3) To project the future pivot high (or it could be an interim high – we can’t know until after the event has occurred) we add the difference between $83.29 and $79.47 – $3.55 to $83.29. This gives us a projected high price of $86.84.
As of the time this is being written the high price on the DXY was $86.74. While these aren’t exact projections, they usually are close. In this case, it wouldn’t be too surprising if the dollar reached $88.47, but a price above $91.00 would be much more unexpected.
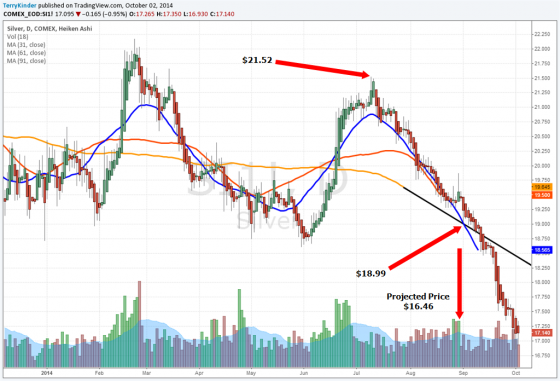
Silver has fallen from it’s pivot high at $21.52 to below $17.00. While predicting the low price can seem a bit like trying to catch the proverbial falling knife, there is reason to think that a silver price trend reversal might be in the cards.
Recently, the silver price has been falling like a stone. It has fallen from a pivot high of $21.52 back in July to under $17.00 today. So, while it might feel a bit like trying to catch the proverbial falling knife, what can the chart tell us about the possibility for a silver price trend reversal?
Our analysis of the above chart of COMEX continuous silver chart is similar to that of the DXY. We will be using displaced moving averages of 31, 61, and 91-days. Below is the analysis of silver based on the chart above:
1) Determine the pivot high – in this case it is $21.52;
2) Project one or more of our displaced moving averages into the future. We use the 91-day moving average because it will cross the 31-day. The 61-day is running almost parallel to the 31-day average so it isn’t much use for projecting the price;
3) Find the level at which the moving averages cross – $18.99. Subtract $18.99 from $21.52 to arrive at $2.53;
4) Calculate the difference between $18.99 and $2.53 – $16.46. $16.46 is our estimated pivot low (or it could be an interim low – we can’t know until after the event has occurred).
As of this moment, silver is just a bit under $17.00. As before, these projections aren’t exact, but based on experience should be accurate within $1.00 – $2.00. Obviously, that is a big percentage difference if we’re looking at $16.46, $15.46, or $14.46. Given dollar seasonal trends, it seems reasonable that the dollar may be at, or very near its high level for now.
Conclusion:
The US Dollar has been placing quite a bit of downward pressure on the silver price, but the US Dollar Index (DXY) is looking pretty stretched. With silver below $17.00 and projected to fall to around $16.46, it may be time to start thinking about a silver price trend reversal.
Keep an eye on the dollar. Its next projected resistance level is $88.47. Should it push much above $91.00, and stay above that level, then we may need to rethink our projections.
Bullion.Directory or anyone involved with Bullion.Directory will not accept any liability for loss or damage as a result of reliance on the information including data, quotes, charts and buy/sell signals contained within this website. Please be fully informed regarding the risks and costs associated with trading in precious metals. Bullion.Directory advises you to always consult with a qualified and registered specialist advisor before investing in precious metals.


Leave a Reply