

It happened! Junior miners moved to new 2023 lows!
 Bullion.Directory precious metals analysis 28 September, 2023
By Przemysław K. Radomski
Founder of GoldPriceForecast.com
If one had opened a short position in GDXJ this year and they held it, they are profitable. The question – of course – is if junior miners and the rest of the precious metals sector are going to continue to move lower from here or will they bottom, just as they did previously when they were trading at similar levels.
While it’s impossible to predict the future in each and every case, looking into the previous patterns can give us insights into what is likely just around the corner. Let’s take a look, starting with junior miners themselves.

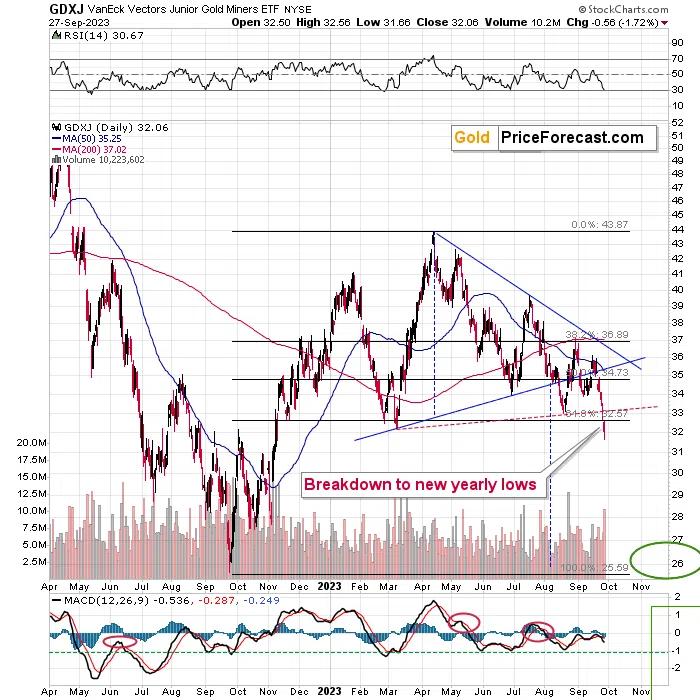
The GDXJ ETF moved and closed at new yearly lows. Its “bigger” counterpart – the GDX didn’t, which only confirms that the proxy that we correctly selected the proxy for our current short position.
The breakdown to new lows is not the only thing that we can see on the above chart, though.
Another important development that we just saw is that the RSI indicator moved very close to the 30 level. This meant that the GDXJ was about to reverse and move higher for at least a while.
Additionally, the GDXJ just formed a reversal candlestick, and it happened on a huge volume. This is also a bullish sign.
However, if we were to see a rally from here, how high could the GDXJ go? And this, my friends, is a better question to be asking right now than one about whether the immediate-term outlook is bullish.
Indeed, based on the RSI and big-volume reversal, the immediate-term outlook is bullish, but the key point here is that based on the breakdown to new lows, it’s quite likely that the GDXJ won’t rally far – if it rallies at all that is.
The GDXJ now has resistance at the previous 2023 low, and the August low, and at the slightly rising red resistance line. This means that the immediate-term upside target is very close – below $33.5.
This, in turn, means that I don’t think that adjusting the current short position is justified from the risk-to-reward point of view. Of course, day-traders might want to take advantage of the possible rebound, but in general, it seems that this move might be too tiny to really take it into account.
Another bullish indication comes from the GDXJ to SLV ratio.

Remember when I commented on this ratio in August? That was the key reason due to which we took profits from our previous short position (before entering a long one, on which we then profited, too). Well, this ratio is providing the same kind of buy indication once again.
Namely, it moved sharply lower, reached the previous lows, and the RSI based on the GDXJ to SLV ratio once again moved below 30. I marked similar situations with green lines, and it they were usually buying opportunities for the GDXJ.
Again, just because a move higher in the GDXJ here might be likely, it doesn’t mean that the GDXJ would be likely to rally far before turning south once again.
Here’s another confirmation of the immediate-term-bullish case that doesn’t necessarily imply much for the following weeks (and it doesn’t change the bearish picture for the big move).

We just saw an intraday reversal in the S&P 500, and it happened right after it reached its rising, medium-term support line while the RSI is close to 30. That’s a very bullish combination. My yesterday’s comments remain up-to-date:
“The thing is that the S&P 500 index just moved below the neck level of the head-and-shoulders pattern (which is bearish for the following weeks). The other thing is that the index moved to the rising support line, which was its short-term downside target area.
On top of that, we have a reading from the RSI indicator that suggests that a corrective upswing is about to be seen.
The correction doesn’t have to be sizable, though. In fact, it’s quite likely that it won’t be. The head-and-shoulders formations and breakdowns below them have a tendency to be followed by short-term upswings that are then followed by much bigger declines.
At this time, the rally could be as small as a move back to the previously broken neckline at about 4,350. This could trigger a corrective upswing in the precious metals sector, but it doesn’t have to be anything to write home about.”
If we see a small rally in stocks, we might see a small rally in junior miners as well.
The USD Index points to a particularly interesting situation as well…

Namely, it’s extremely overbought from the short-term point of view, but at the same time, we just saw a breakout to new yearly highs.
The RSI is well above 70, indicating a likely turnaround… And yet… If you look at what happened to the gold price in the two previous cases when we saw the same thing, you’ll discover that gold bottomed in one of those cases, but in the other (May 2022), it continued to decline, then corrected, and then moved even lower.
Consequently, ultimately, the implications are not as bullish for the precious metals market as they might seem at first sight.
Is a pause or a small correction here likely? Yes. Is a major bottom likely as well? No.
What to do with this information? Of course, it depends on your approach to trading/investing. In my view, however, it’s not necessarily optimal to try to time each and every tiny move. Especially that…

Especially since the HUI Index (flagship proxy for gold stocks) has been behaving very similarly to what it’s been doing in early 2013. I marked that situation with black arrows. Even the RSI is in a similar position.
This seems to be the final part of a very broad head-and-shoulders pattern that leads to waterfall selling. When that happened in 2013, miners were underperforming gold to an extreme extent, and we’ve seen exactly the same thing recently.
The thing is that in this similar situation in 2013, it wasn’t necessarily a good idea to try to try to get in and out of the market during the decline. The move lower was powerful, and the key thing about it was not missing the huge move. Trying to time each rebound makes the above much more difficult.
The bottom line is that the profits on the current short position in the GDXJ are likely to increase in a massive manner in the following weeks, and whether we see a small correction here or not doesn’t really matter. The profit-take levels for this downswing remain up-to-date.
Przemyslaw Radomski


Przemyslaw K. Radomski, CFA, has over twenty years of expertise in precious metals. Treating self-growth and conscious capitalism as core principles, he is the founder of GoldPriceForecast.com
As a CFA charterholder, he shares the highest standards for professional excellence and ethics for the ultimate benefit of society and believes that the greatest potential is currently in the precious metals sector. For that reason it is his main point of interest to help you make the most of that potential.
This article was originally published here
Bullion.Directory or anyone involved with Bullion.Directory will not accept any liability for loss or damage as a result of reliance on the information including data, quotes, charts and buy/sell signals contained within this website. Please be fully informed regarding the risks and costs associated with trading in precious metals. Bullion.Directory advises you to always consult with a qualified and registered specialist advisor before investing in precious metals.


Leave a Reply