

What a beautiful and profitable breakdown in junior miners! And that’s not all!
 Bullion.Directory precious metals analysis 06 February, 2023
By Przemysław K. Radomski
Founder of GoldPriceForecast.com
This part of the bigger decline is just starting, so junior miners still have some room to fall. Gold, silver, and the S&P 500 futures are calm in today’s pre-market trading, but don’t let that fool you – the market is about to slide once again.
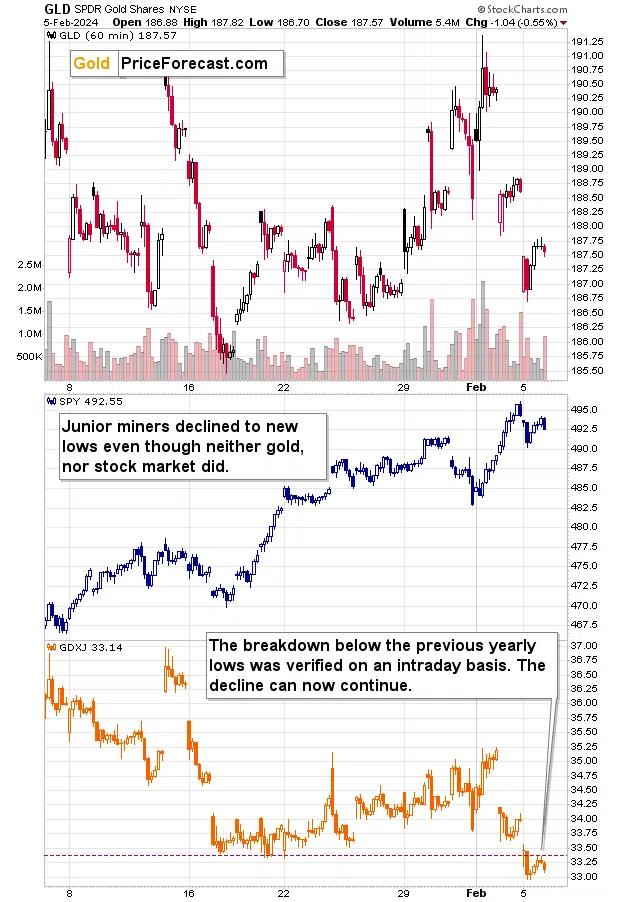

The first reason is the same as it was before – extreme underperformance of mining stocks relative to both: gold and stocks. On the above chart you can see how far miners fell (lowest part of the chart) compared to gold’s (upper part) and stocks’ (middle part) decline.
Stocks just moved a bit lower from their recent top, and while gold’s decline was significant, it didn’t take the price of the yellow metal to new yearly lows. And yet, that’s where the GDXJ closed yesterday’s session.
Moreover, the breakdown below the previous 2024 lows was already verified on an intraday basis. During yesterday’s session, miners moved first plunged, then rallied back to the previously broken levels, and finally declined before the closing bell. That’s a breakdown, and its verification all in one day.
What a way to start a week!
How low can junior miners go?

To about $30.
To clarify, I think that this is only the short-term target for the next 0-3 weeks), after reaching which we would be likely to see a rebound, and then another big move lower.
But why $30, or more precisely, the area just above $30? Because of two reasons:
- That’s where we have the 2023 lows.
- That’s’ where we have the rising, long-term support line that’s based on the very important 2020 and 2022 lows.
Each of them provides strong support on its own, and their combination is very strong.
The RSI indicator is currently below 50, so once the GDXJ declines some more from here, it’s likely to move lower. It’s quite likely that when GDXJ approaches $30, the RSI based on it would be trading close to 30, which would be a buy signal for the miners.
Will we be taking profits from our short positions at this time?
Yes (based on the data that we have right now – of course, it might change in the meantime).
Trading is not about being married to a position or outlook, but about opening and exiting positions (in other words, about taking profits and entering new positions later), and we exited our previous short position on Oct. 11, 2023. Also, the research behind our new approach to trading showed that this approach (trading instead of keeping a position open a very long time) is critical when it comes to leveraged ETFs. And this was particularly true when it came to the analysis of my previous signals – actually following them (and also engaging in long positions) rather than keeping a short position open at all times proved to be much more profitable.
Will we be opening fresh long positions when the GDXJ moves close to $30?
That’s probable at this time, but I’d like to see what will be going on in other markets when the GDXJ approaches $30. If the USD Index looks toppy, and the general stock market looks like it’s about to take a breather, then profiting from a rebound in the GDXJ might indeed be a good idea.
Also, here’s an update regarding the profitability of our recently (since Oct. 8, 2021) featured trades (hypothetical trades, but based on real, verifiable trading ideas such as the one linked above, no tax or trading costs are assumed, other assumptions are using all capital and reinvesting it in each trade; when available prices mentioned in the Alerts are used, and closing prices are used in other cases).

In short, the profitability lines are climbing nicely, and the new approach shows its superiority in the long run.
Of course, all trades are risky, and I can’t guarantee any kind of performance, but the above chart is based on real prices that were available when the analyses were published, and it shows just how much there was to gain.
Will those profitability lines get even steeper?
Again, I can’t promise that, but that does seem very likely to me given how many confirmations the precious metals sector (in particular junior mining stocks) is providing us with.
Congratulations on your current profits and remember that the best is yet to come.
Przemyslaw Radomski


Przemyslaw K. Radomski, CFA, has over twenty years of expertise in precious metals. Treating self-growth and conscious capitalism as core principles, he is the founder of GoldPriceForecast.com
As a CFA charterholder, he shares the highest standards for professional excellence and ethics for the ultimate benefit of society and believes that the greatest potential is currently in the precious metals sector. For that reason it is his main point of interest to help you make the most of that potential.
This article was originally published here
Bullion.Directory or anyone involved with Bullion.Directory will not accept any liability for loss or damage as a result of reliance on the information including data, quotes, charts and buy/sell signals contained within this website. Please be fully informed regarding the risks and costs associated with trading in precious metals. Bullion.Directory advises you to always consult with a qualified and registered specialist advisor before investing in precious metals.


Leave a Reply