

So far, oil has managed not to plunge lower into the $30.00 to $35.00 range as many had predicted. Can the oil price hold its ground?
 Bullion.Directory precious metals analysis 10 March, 2015
By Terry Kinder
Investor, Technical Analyst
We have reviewed the idea of whether or not oil may be at or near a price bottom both here and here. Additionally, the subject of the oil price was touched in another article covering gold, GLD, SLV, JDST, UWTI and Bitcoin. So, while you might think the subject has been exhausted, there are still a couple of relevant things to add in order to fill out the picture of where the price is currently.
A note about the construction of the first chart below: It’s useful from time to time to examine how price charts are constructed. At times charts probably look random and haphazard. Nothing could be further from the truth. A well-constructed chart is built around certain principles. In the case of the first chart below, it was built around the pivot low of $10.49 that was made in December of 1998.
From that $10.49 low a 45 degree line was drawn. 45 degree lines are important natural, geometric trend lines and also serve other useful purposes in both constructing charts and forecasting future prices. The 45 degree line in this chart is critical in the construction of the series of squares you see. A brief synopsis of the chart construction is as follows:

- First, the 45 degree line was drawn from the December 1998 pivot low price of $10.49. In order to construct a good chart that can help spot trend reversals it is critical to use important pivot high or low prices;
- Then, we found the pivot high price for WTI crude oil which was $147.27. That number was then multiplied by numbers such as 0.875, 0.750, 0.667. 0.50, 0.25, 0.125, etc. to provide the horizontal lines you see on the chart. Variations of those numbers were used such as 1.125, 1.25, 1.50, 1.667, 1.750, 1.875, etc. to create additional horizontal lines;
- The vertical lines were placed at points where the 45 degree line drawn initially and the horizontal lines crossed each other. This eventually resulted in a series of squares;
- Diagonal lines were drawn at 45 degree angles to divide the individual squares into four triangular sections;
- A trend-line was drawn from the $10.49 pivot low, touching the January 2009 low, and extending out past the right edge of the time scale;
- Finally, a Gann Fan was added to the chart and the 1/1 angle was placed to line up with the 45 degree angle drawn earlier on the chart. By aligning the 1/1 angle with the 45 degree angle, this allows us to more accurately assess where price is in relation to the various angles on the fan, and should give us a good idea of how far away a potential bottom price, in terms of dollars, might be.
Gann Fan
The oil price has found support at its trend-line dating back to December of 1998. Back in January of this year, the price did manage to break below that line, but ended the month above it.
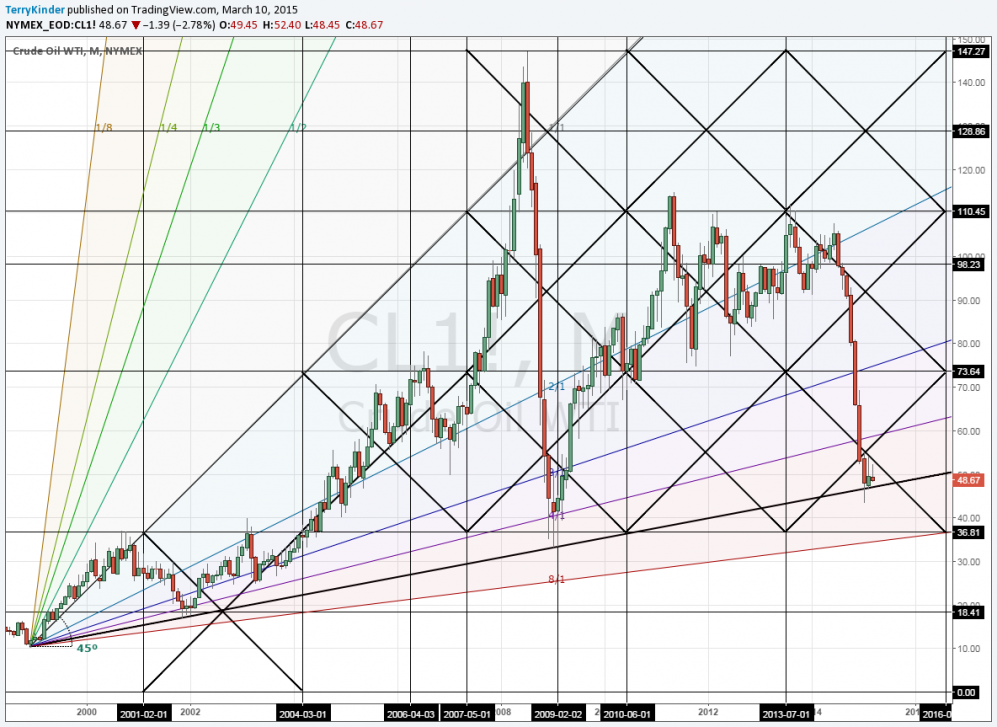
West Texas Intermediate (WTI) crude has managed to hold support at its trend-line dating back to December of 1998
Looking at the chart, it is interesting to note that back in 2008-2009 when the oil price plunged from $147.27 to as low as $37.15, the lowest monthly close was $41.68. Thus far, in 2015 the lowest monthly close has been $48.24 back in January. Also, note that back in 2009 that once the price managed to move above the downward sloping top half of the diamond-shaped pattern, it didn’t look back.
So, the challenge for the oil price is whether or not it will be able to rise above the downward sloping portion of the current half-diamond pattern. You can see that it has tested that line several times and been unable to overcome it. It could take up until August before it is clear whether or not the WTI crude price will move above the line or not.
Should the crude oil price weaken and fall below the long-term support line, that would set up the possibility of a visit to the bottom of the Gann Fan. Currently the bottom of the Gann Fan is somewhere near the $34.50 level. Because of that, I tend to discount some of the panicked stories in the news that the oil price could slip below $30.00. At this point, $34.50 (perhaps slightly below) to $35.00 would be near the lowest the oil price should go barring some unforeseen / unprecedented disaster. Could something distatrous happen to drive oil below $30.00? Well, we should never say never, but it isn’t very probable at this point.
Oil: Weekly, Monthly, Yearly Pivots
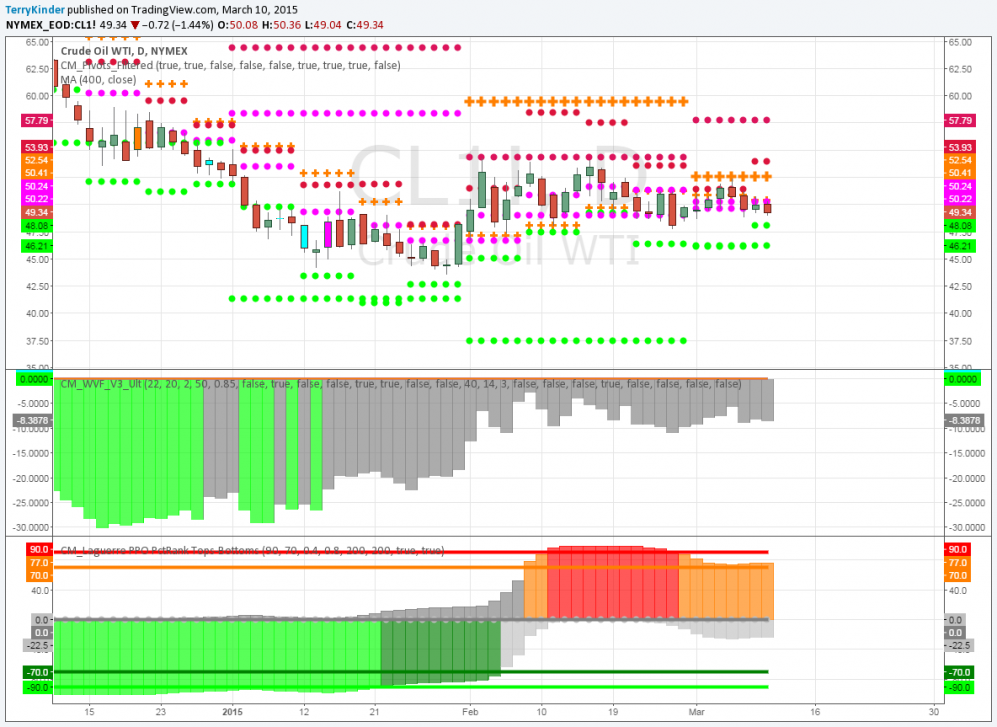
On the daily chart, with weekly, monthly and yearly pivots visible, oil shows weekly support at $48.08 and monthly support at $46.21
The oil price, in this daily chart showing weekly, monthly and yearly pivot support, has support at $48.08 on a weekly basis and $46.21 on a monthly basis. If you look at the bottom of the chart you will see the Laguerre Tops and Bottoms Indicator. You can see by the red bars that the oil price has been relatively high according to the indicator and that the price was likely to back off some. It appears as if oil is in the process of coming down some in price. However, the amount of the decline has been relatively small. If you look further to the left, you’ll see declines where there are light green bars. Light green bars indicate an extreme oversold condition. At some point we should expect oil to move from overbought to oversold. How the oil price reacts to this eventual change will likely determine whether or not price support levels for oil hold or not.
Oil: Monthly, Yearly Pivots
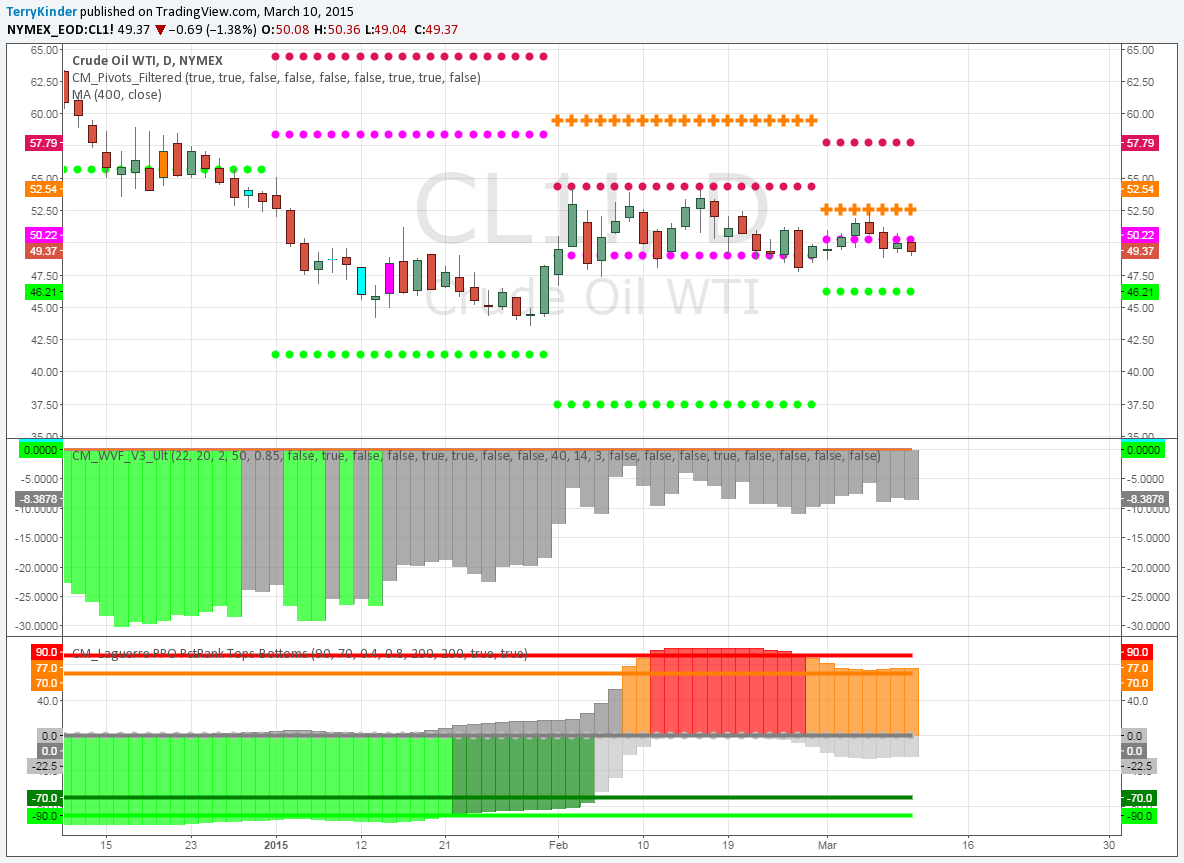
The oil price is supported on a monthly basis at $46.21. Should that support fail the only other support is a yearly one at $15.89 (not visible on the chart)
Our final oil chart shows the daily chart along with the monthly and yearly pivots. Oil is supported by the monthly price pivot at $46.21. If the $46.21 pivot gives way there is no support below it until a yearly pivot at $15.89 (not visible on this chart). However, even if the $46.21 pivot were to be violated, I’m not expecting the oil price to plunge anywhere close to the $15.89 level.
Conclusion
- We highlighted the importance of the 45 degree line in a well-constructed price chart. The first chart we reviewed was constructed around one such line;
- Despite financial media promoting the idea of a plunge in the oil price below $30.00, it does not appear as if this will happen barring some unforeseen disaster;
- The oil price currently has weekly support at $48.08 and monthly support at $46.21. Current monthly support of $48.08 is near the $48.24 monthly low that was reached back in January of this year;
- The Gann Fan indicates the bottom for the oil price, should the bottom of the fan be touched, would be around $34.50 to $35.00 if that occurred this month. After that the potential low slowly rises higher each month;
- Trend-line support dating back to December of 1998 is still in place. The price did fall below that support to $43.58 back in January, but closed above support on a monthly basis;
- Once the oil price moves above the diagonal line formed by the half-diamond it is likely we won’t see any substantial declines on a monthly basis for a sustained period of time.
Despite calls for sub-$30.00 oil, it looks unlikely this will occur. However, it isn’t out of the question that the oil price could move lower. Should the long-term trend-line, dating back to December of 1998, be violated on a monthly basis, then we face the possibility of the oil price moving below $40.00, perhaps to the mid-$30.00 range, depending on the month that the trend-line violation (should it happen) occurs.
Bullion.Directory or anyone involved with Bullion.Directory will not accept any liability for loss or damage as a result of reliance on the information including data, quotes, charts and buy/sell signals contained within this website. Please be fully informed regarding the risks and costs associated with trading in precious metals. Bullion.Directory advises you to always consult with a qualified and registered specialist advisor before investing in precious metals.


