

We look at Gold, GLD, SLV, JDST, UWTI and Bitcoin
 Bullion.Directory precious metals analysis 10 March, 2015
By Terry Kinder
Investor, Technical Analyst
The more charts the merrier. We’ll take a look at gold, GLD, SLV, JDST, UWTI and Bitcoin.
Gold: What goes up…
One of the wonderful and terrible things about charts is you can look at them from different, even opposite, perspectives.

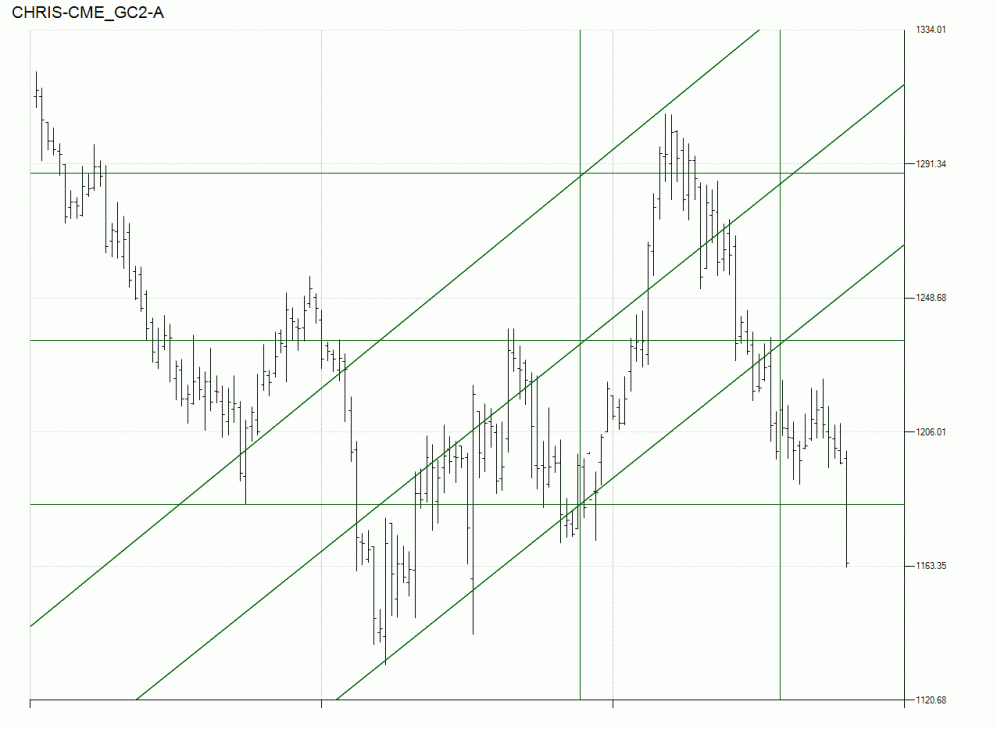
The gold price uptrend off the $1,130.40 low has clearly ended
The above chart looks at gold from a bullish perspective after hitting its low of $1,130.40. Bullishness seemed to be the prevailing view amongst many analysts, with some calling that level the bottom. Perhaps it is. However, the uptrend off the low has been clearly broken.
A few notes about almost all of the charts that appear in this article: Most of these charts were created using Swing Master Chartist from TradingFives. They offer a 14-day free trial on the software, and it’s well worth taking a look at.
Noteworthy features of the charting software are its use of Gann, Hurst and Fibonacci analysis techniques that, as far as I know, you aren’t going to find in one single piece of software anywhere else. Not to sound like a walking advertisement, but the TradingFives books linked to above (at least the two I have read – Hurst and Gann) are quite good. All three are included if you buy their Swing Master Chartist software. I don’t get anything for sending you to their site or if you make a purchase. I just believe what they have to offer is worth checking out.
Particularly relevant to the charts featured in this post is Gann Analysis. The software that created these charts does so conforming to Gann’s methods, including the Square of Nine and squaring price and time.
Squaring price and time means that for each unit of price there is one unit of time. These units can vary. For example, over time could have something go up in price $10.00 for each trading day. You could have an hourly chart go up $0.10 per hour, etc. Having a chart where time and price are squared allows you to more easily see when price has turned higher or lower.
The first gold chart we looked at is a good example of this. Squaring time and price helps remove subjectivity in drawing trend lines – although I’m not going to say there still isn’t a degree of subjectivity still. However, the software conforms to Gann Analysis principles and you have a very limited amount of leeway regarding how trend lines are placed on the chart. The same can’t be said of many other pieces of charting software which allow one to put virtually any trend line they see fit on the chart.
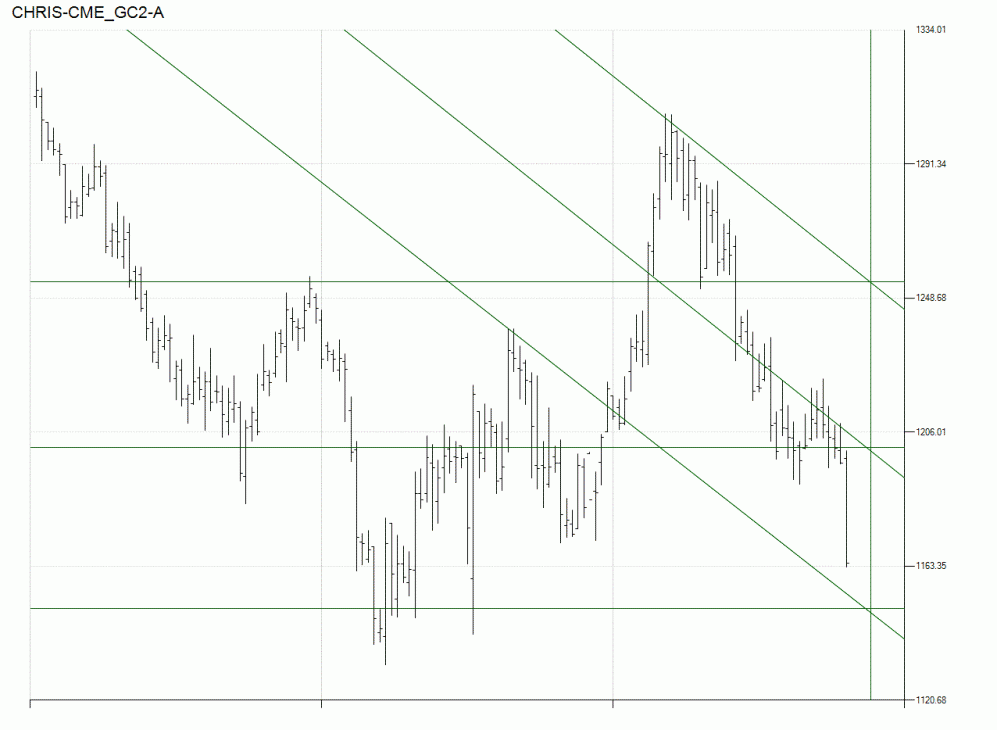
We can also look at the gold price as within a declining price channel
The flip side of the first gold chart drawn from a bullish perspective is our second chart. In this chart the channel has been drawn down in a more bearish configuration. You may notice that it is equally, if not more, plausible than the first chart. In fact if one wanted to they could add a few additional trend lines to the left of the lower channel line.
This chart clearly shows the push and pull of the buls and bears around the $1,200.00 (or $1,208.00 if you prefer) level. When the $1,200.00 level finally gave way, gold fell through the $1,191.00 and $1,174.00 (not specifically shown on chart) levels as well. The next major support level is at $1,157.00. Should that level give way then that would set up the possibility of price visiting the $1,140.00 level.
Again, since this chart conforms with Gann Analysis techniques, the trend lines are less subjective and they conform quite nicely with the price action seen on the chart. Anything one can do while analyzing price to make the analysis less subjective is for the better.
GLD
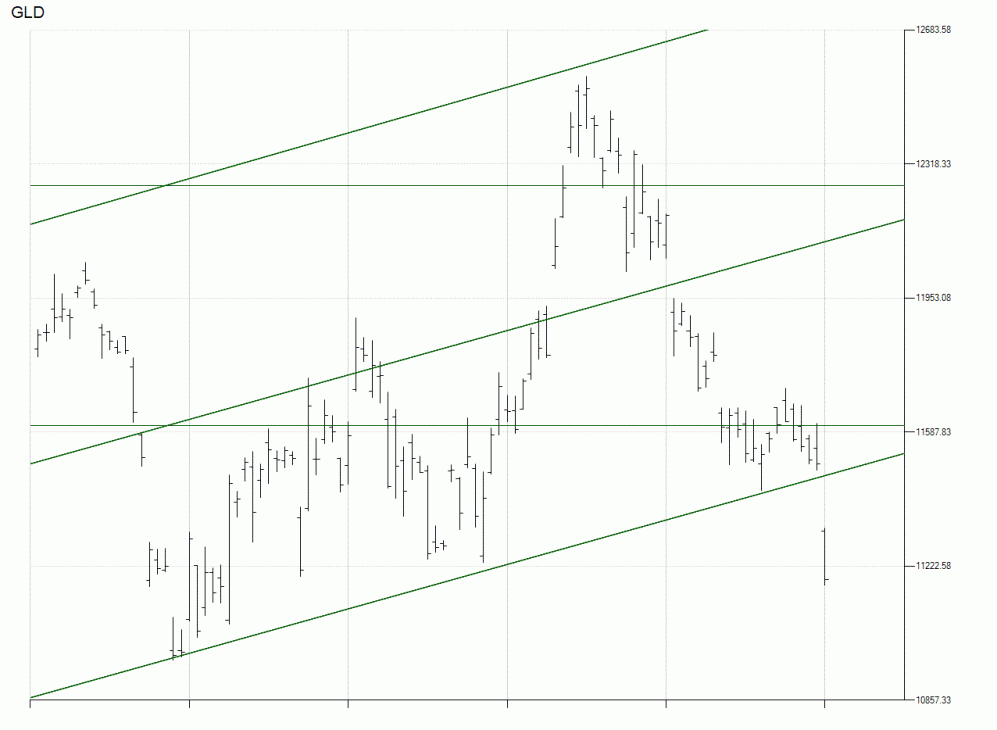
If we look at GLD as in an uptrend, that move higher has clearly broken down
Note: In order to square price and time on the GLD charts properly the prices were multiplied by 10. That means that to read the price scale on the right hand side of the chart you need to move the decimal one place to the left. For example, rather than the price being $1,122.26 it is actually $112.226 or $112.23 if rounded.
Despite the fact that GLD is widely hated amongst some quarters of the gold community, it serves as a good proxy for the price of gold. The chart above has the additional benefit of clearly showing the break lower in price. So, if you were looking at GLD from a bullish perspective, the break lower on the above chart was like a flashing neon light screaming “Sell!”
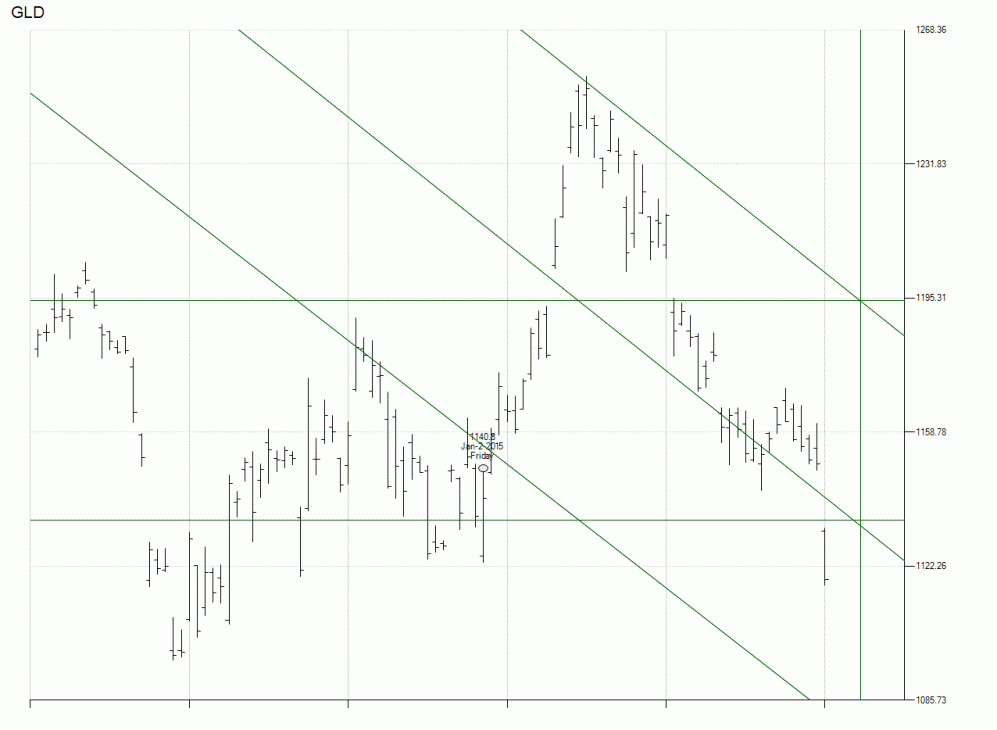
GLD convincingly broke below mid-channel, a bearish sign
Not surprisingly, if you were bearish on GLD the chart gave you a very clear sign, by gapping down below the middle of the price channel, that you were correct in believing price was going to continue moving lower. The GLD price clearly has work to do if it is to break the downtrend and move higher.
SLV
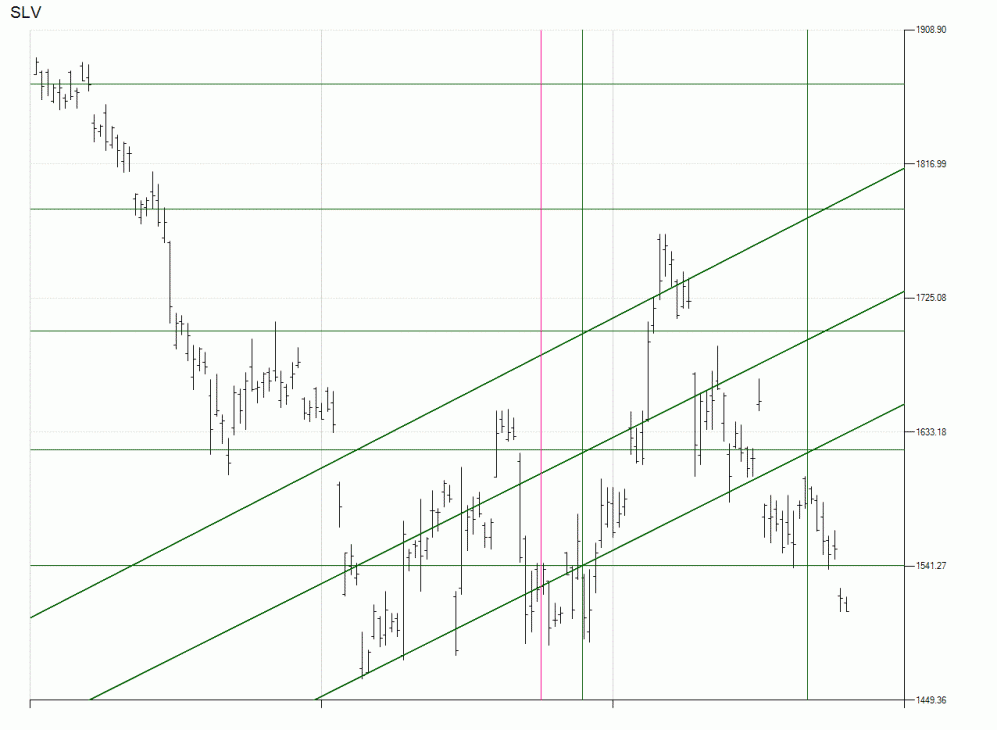
SLV looked bullish for a while until it broke down out of its channel
Note: The SLV price, in order to square it properly with time, was multiplied by 100. So, for instance, where price says $1,541.27, the decimal should be shifted over to the left two places. Therefore the price would read $15.41 when rounded.
SLV, is as good a proxy for the silver price as GLD is for the gold price. If you were bullish on the SLV price, then the fact that price gapped down, falling out of the upward channel, might have given you pause. Since gapping lower, SLV has not managed to re-enter the upward channel. Notably it also gapped lower near the $15.41 mark which should probably be read as another sign of weakness.
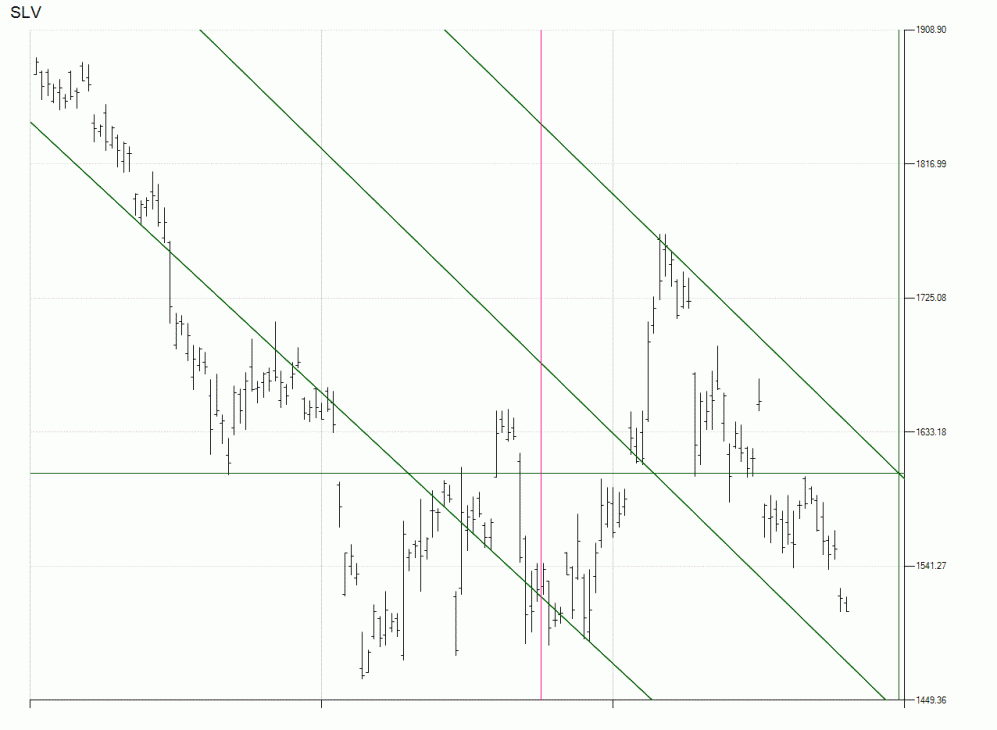
The flip side view of SLV is that it is in a downward channel
SLV, oddly enough, from the bearish perspective looks a little better than GLD. It has managed to remain above the mid-channel line for the moment. However, SLV is essentially in the same position as GLD – it needs to find some upward momentum if it is going to break out of its downtrend.
JDST
Note: In order to square time and price, the price of JDST was multiplied by 100. You must shift the decimal over two places to the left in order to read the price correctly.
We recently wrote about JDST, the 3x leveraged bear junior gold mining index ETF, and its relationship to the gold price. JDST represents a bet that gold and GLD will decline in price. This has been a decent bet but, of course, no trend either up or down lasts forever.
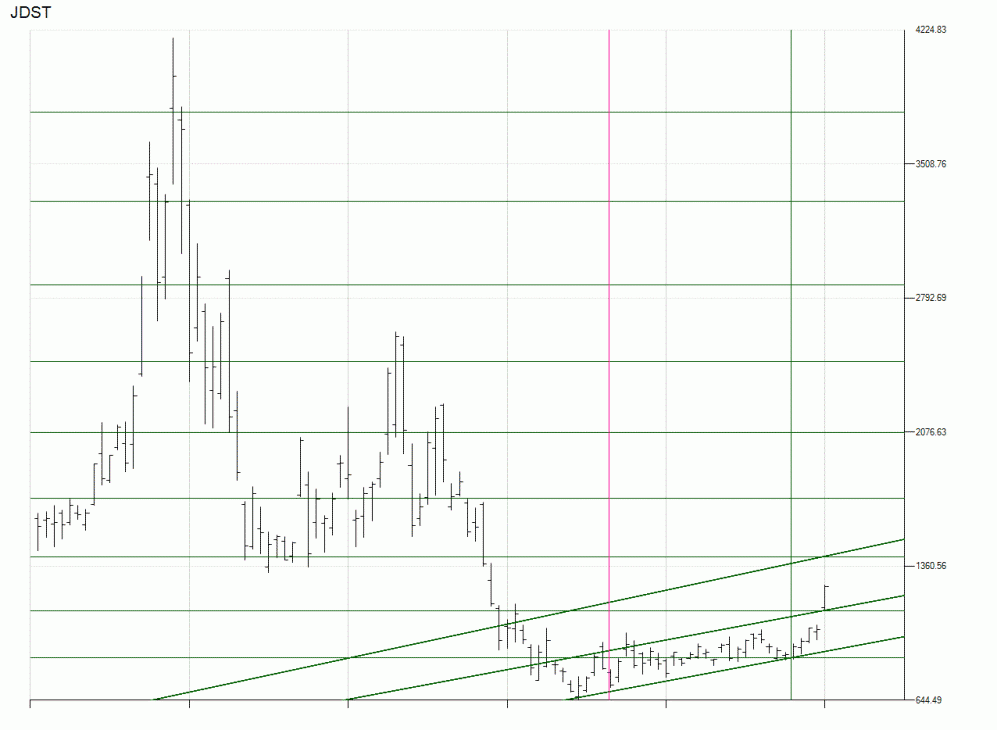
JDST, the 3x leveraged bearish junior miner index ETF leapt above mid-channel. Bullish for the ETF, but bearish for gold
Considering the depths to which JDST collapsed, you could argue that it would have been a bet that Captain Obvious would have made. Of course, everything seems more obvious after the fact.
JDST is rather the mirror image of the gap lower in GLD. JDST recently gapped up above the mid-channel line. It has been looking quite strong. I would expect, at some point, JDST will back off in price at least a little. However, as long as it can remain above the bottom of its price channel, we should expect it to keep rising. This, unfortunately (or fortunately depending on your perspective), points towards a lower gold price until something acts to reverse the current situation.
UWTI
Note: The price of UWTI was multiplied by 1,000 in order to square time and price. In order to read the price correctly you need to the decimal over 3 places to the left.
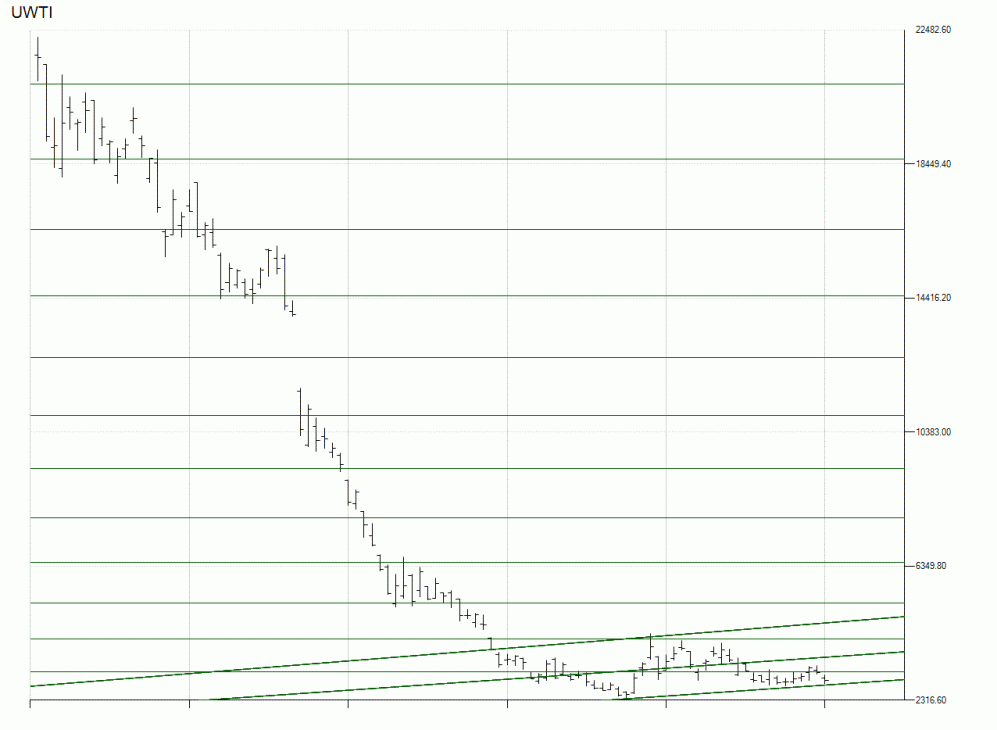
UWTI, a 3x leveraged bull WTI crude oil ETF is near the botom of its channel, but appears to have found support for now
UWTI, a 3x leveraged bullish WTI (West Texas Intermediate) crude oil ETF has managed to defy expectations that the oil price would crash to $35.00, $30.00 or even lower. I have previously written articles here and here arguing that the price of oil could be at or near a bottom.
Thus far, oil has managed to stay above its low near $43.58. However, it hasn’t really managed to achieve much altitude in price. As you can see in the above chart, UWTI is very near the bottom of its channel. Although not pictured, and I haven’t looked at my WTI charts in a day or so, it’s likely the same situation for the crude price. If the price breaks below the bottom of the channel, then that would indicate that the crude oil price likely has further to fall.
While the chart is drawn as a fairly shallow uptrend in the price, you could equally view it as purely sideways action. Either way, if the price is unable to stay above the bottom of the channel, then we could see a breakdown similar to what we witnessed in the gold price where there was a fairly decisive move below what had been a key tug-of-war price level between the bulls and bears.
Given the shallow nature of the price channel, I’m not fully convinced that the oil price is out of the proverbial woods yet. I would want to see either a significant amount of time where the price winds slowly higher (not ideal, but acceptable) or the oil price gapping above the top line of the channel (preferred). Until there is either more time where the price of oil moves higher, or a decisive move higher, I would be suspicious of the oil price at these levels. While certainly oil has defied expectations that it was going to crash soon, that doesn’t mean a future breakdown isn’t just taking its own sweet time.
Bitcoin
Although Bitcoin is somewhat controversial amongst some within the gold community, it represents a similar hedge against government mismanagement of the currency, economy, etc. While we could debate endlessly such issues as whether Bitcoin has intrinsic value, for the purposes of our discussion here, it doesn’t really matter. What is important is that some slice of the population is buying Bitcoin as a means of holding some portion of their wealth outside of the corrupt system of governments and banking. Sounds familiar, doesn’t it? While you can certainly question whether it is or isn’t the best vehicle to protect your savings, some portion of people who purchase Bitcoin are using it for just that purpose.
Undeniably too, there is some speculation in Bitcoin, but where isn’t there some speculation in this world? Interestingly, although I’m not attributing any causation here, Bitcoin has made a pretty nice run higher while the euro dropped to levels not seen in over a decade. So, it is conceivable that some of the run up in Bitcoin represents people seeking safety from their own declining fiat currencies. A person could definitely purchase Bitcoin in one currency, hold it, and then convert it into another.
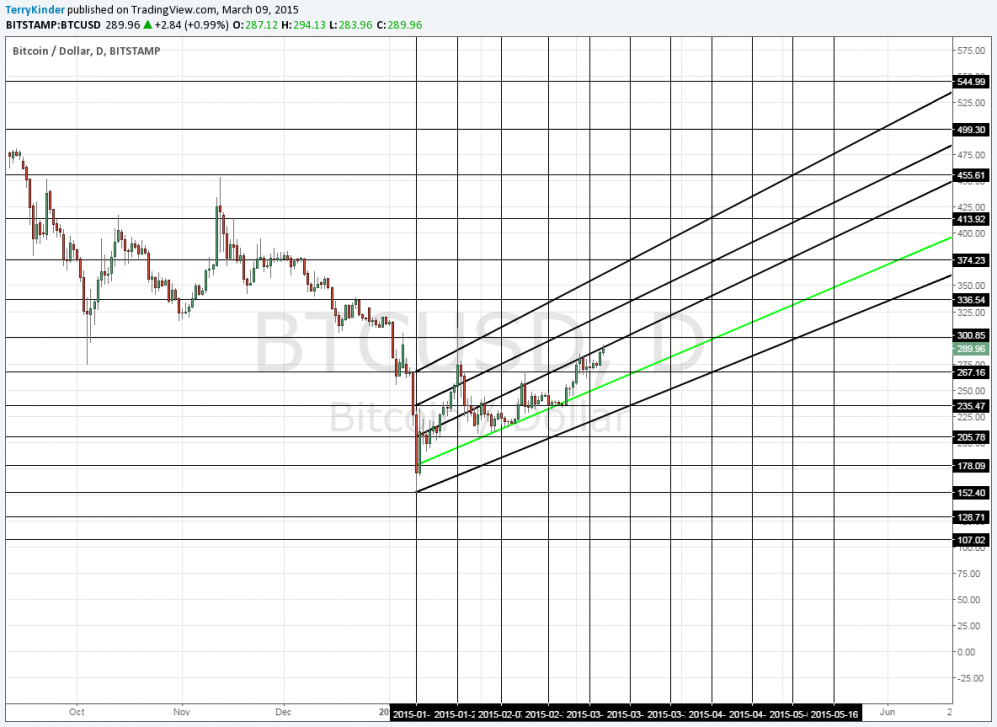
But apart from idle speculation as to the “why” behind the reversal in the Bitcoin price is the quite impressive reversal from $152.40 all the way back up to over $290.00. Some might believe this is the equivalent of a dead cat bounce. However, I don’t think so. Months ago my Point and Figure charts pointed to a low Bitcoin price of $140.00. The $152.40 price was only $12.40 from that projected low. At this point, I suspect the Bitcoin price will eventually retrace up to 50% of the prior high of $1,163.00 – that is to say the Bitcoin price will likely reach $581.50 at some point in the future. What will happen after that remains to be seen.
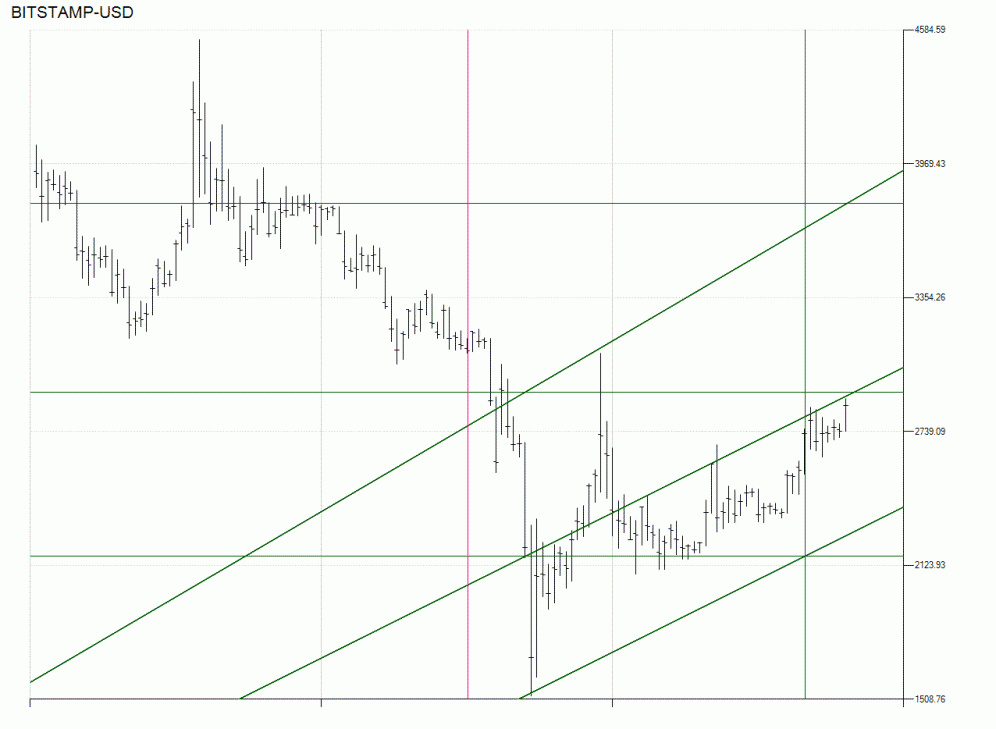
After making a low of $152.40, Bitcoin has had a nice bounce
Note: In order to square time and price the Bitcoin price was multiplied by 10. In order to read the price correctly you will need to shift the decimal over one place to the left.
As long as the price of Bitcoin stays within the price channel I expect it to continue higher. The fact that the Bitcoin price has been hugging fairly close to the middle of the price channel appears, to me, a sign of strength. Thus far, most dips in price have been met with buyers – a sign that there is a strong bid in the market.
As long as Bitcoin stays above the green line its uptrend is clearly in place
The final Bitcoin chart is one I created over at TradingView. In contrast to the previous charts I had to manually calculate price levels and the number of price bars to set the horizontal and vertical lines. This means there is a certain amount of imprecision in the chart, although it isn’t significant. The bottom line in this chart, similar to the previous one, is that as long as the Bitcoin price remains above the green line the price action should be considered bullish.
Conclusions:
- The gold price is likely to remain weak es evidenced by both gold and GLD falling out of bullish price channels
- The situation for SLV doesn’t appear quite as desperate as for gold, but SLV still needs something to act on it to reverse its downward price action
- JDST is the mirror opposite of gold and GLD. When GLD gapped down in price, JDST gapped up. Continued weakness in the gold price means that JDST will likely advance higher. While I expect at some point the JDST price will back off a bit, the outlook currently remains bullish
- UWTI, a leveraged play on the crude oil price, has – so far – managed to remain within a mildly bullish channel. Should the price fall below the channel then expect the crude price to decline, perhaps substantially
- Bitcoin appears to be bouncing off of its low of $152.40. I suspect $152.40 will be the low price for now. There is a good probability that Bitcoin will make a run at a 50% retracement of its $1,163.00 high, which would represent a price of $581.50
While the current situation for the gold price may not be what some would have hoped for, the situation will reverse eventually. This could take time however. For those who have not purchased gold or silver you might consider gradually pyramiding your purchases – buying a certain amount but leaving a cash reserve to make future purchases should the price be favorable. As for more speculative investments, I currently favor JDST and Bitcoin. If I had to choose just one it would be Bitcoin currently as I believe it has good upside potential. Remember, always consult a licensed, professional investment advisor before taking any decision to invest and be sure to conduct your own due diligence.
Bullion.Directory or anyone involved with Bullion.Directory will not accept any liability for loss or damage as a result of reliance on the information including data, quotes, charts and buy/sell signals contained within this website. Please be fully informed regarding the risks and costs associated with trading in precious metals. Bullion.Directory advises you to always consult with a qualified and registered specialist advisor before investing in precious metals.


