

Santa’s sleigh crashed and burned.
 Bullion.Directory precious metals analysis 7, January 2016
By Christopher Lemieux
Marco Strategist; Twitter @Lemieux_26
Wall Street was looking for a “rip your face off” Santa Claus rally in equities, but Santa’s sleigh crashed and burned. Equities limped into the New Year, and that is when the reality check began.
Guys and Gals, risk for $SPY and $QQQ is still to the downside. Though more down potential is probably in #techs
— Chris Lemieux (@Lemieux_26) December 22, 2015

$SPX futs dropping into negative territory after rebounding. If 1995 is closed under, 1945 should be easy
— Chris Lemieux (@Lemieux_26) January 5, 2016
Only a small number of analysts went against the grain and faced ridicule in order to bring the underlying truth to their readers. On Bullion Directory, we have extensively covered the slowing growth picture in global markets and the potential outcomes.
While predicting that volatility would return in 2015, including the S&P 500’s first correction in four years, the culmination of central bank intervention is nearing. I was even bold enough to call out a 2016 recession in the U.S. last April, and that is looking ever so more probable.
In regards to gold, traders are flying into safety assets as global equity markets are quickly beginning to unravel. In “Gold Trends Near Resistance After Consecutive Session Gains,” given that price action were to remain supported at key levels.
On the four-hour chart, gold is hovering just under $1,080 and the 200-4H EMA, which will act as dynamic resistance until a confirmed breakout occurs. Price action is trading at the upper-end of a symmetrical triangle, while a minor descending support within the pattern is found (dotted line). Within the pattern, support is found at $1,074 and $1,066, while a confirmed breakout could signal a move higher to $1,088 and $1,095, potentially $1,111, per ounce.
Price action was able to trade above $1,100 – a nine-week high. Gold can press higher as turmoil continues. However, on a near-term basis, gold prices are reaching extended levels.
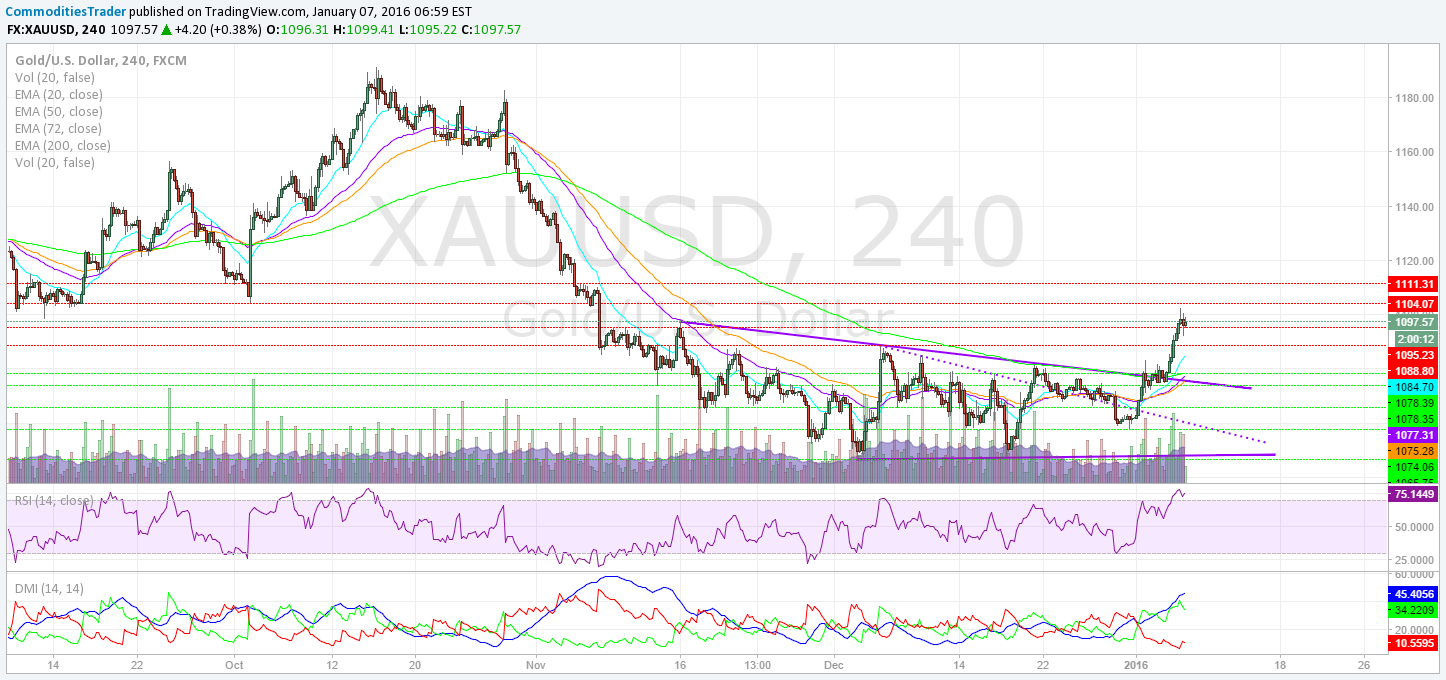
After bouncing of support within the triangle pattern, gold kept testing the descending resistance until it finally broke higher. The intraday momentum is quite strong with the ADX above 34, but the + DMI is ticking lower. This could suggest price digestion is nearing.
The 4H chart is showing potential for a 50/200 4H EMA bullish convergence, and this remains supportive.
On the daily chart, the ADX is just beginning to tick up with a positive +/- DMI divergence, which could mean the medium-term rally is not over.
If $1,111 is achieved (with a confirmation close), gold can rally right into the 200-day EMA, or roughly $1,130.
Bullion.Directory or anyone involved with Bullion.Directory will not accept any liability for loss or damage as a result of reliance on the information including data, quotes, charts and buy/sell signals contained within this website. Please be fully informed regarding the risks and costs associated with trading in precious metals. Bullion.Directory advises you to always consult with a qualified and registered specialist advisor before investing in precious metals.


Leave a Reply