

With the gold price teetering between $1,200.00 and the $1,100’s, what can JDST tell us about the direction of the gold price?
 Bullion.Directory precious metals analysis 5 March, 2015
By Terry Kinder
Investor, Technical Analyst
Yesterday the gold price just managed to close above $1,200.00. Gold has shown little upward momentum as of late. The good news is that gold has managed to hold above $1,200.00. The bad news is that it is barely hanging on. While we can certainly gain some insight looking at gold price charts, it may be helpful to take a look at some charts of what basically amounts to the opposing view. JDST, a 3x bear junior gold miner index ETF, offers that opposing view. It essentially represents the 180 degree opposite viewpoint from that of gold. So, if JDST is going up, gold is moving the opposite direction.
Gold Triangles
But first, before looking at JDST, let’s take a brief look at the gold triangle pattern highlighted in Gold Triangles, Fib Spirals, Pivot Points.

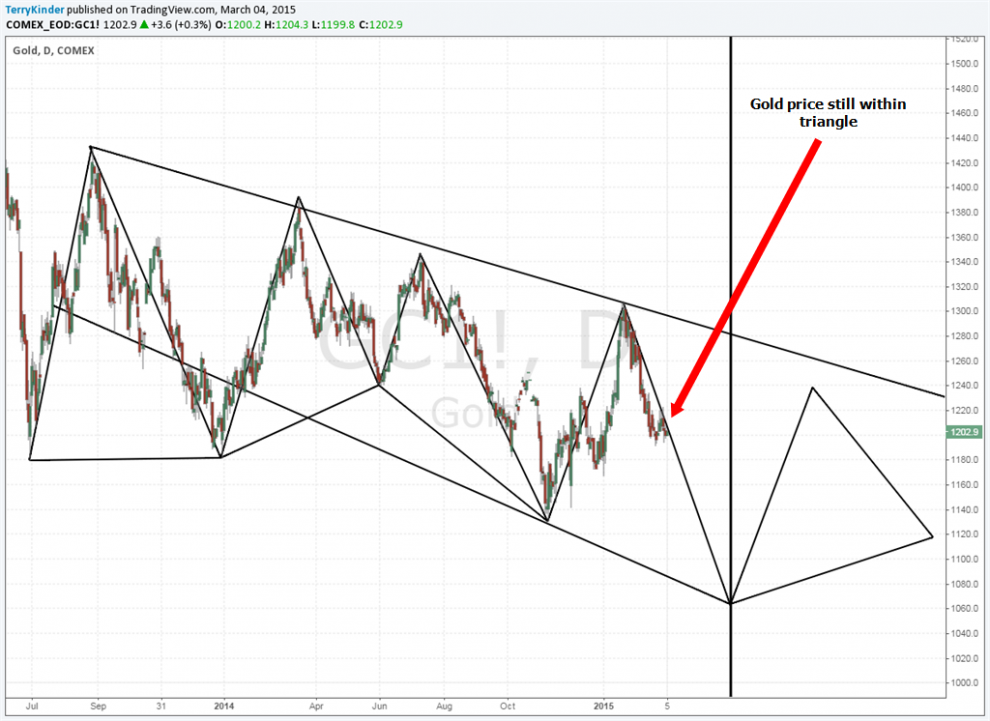
The gold price, as outlined in a previous post, is still within a triangle
The situation has changed little since our original post. Gold has continued to follow the hypotenuse of the triangle lower. This is simply a matter of geometry and geometric patterns formed by the gold price. It is a pattern that has been repeating since the middle of 2013. On top of that there is a clear descending resistance line that gold has been unable to break above. So, until something acts to move the price out of the current pattern we shouldn’t expect it to reverse.
Gold Squares
Continuing on with geometric patterns, what follows are two 30-minute charts of JDST. The first chart includes the price bars while the second does not.
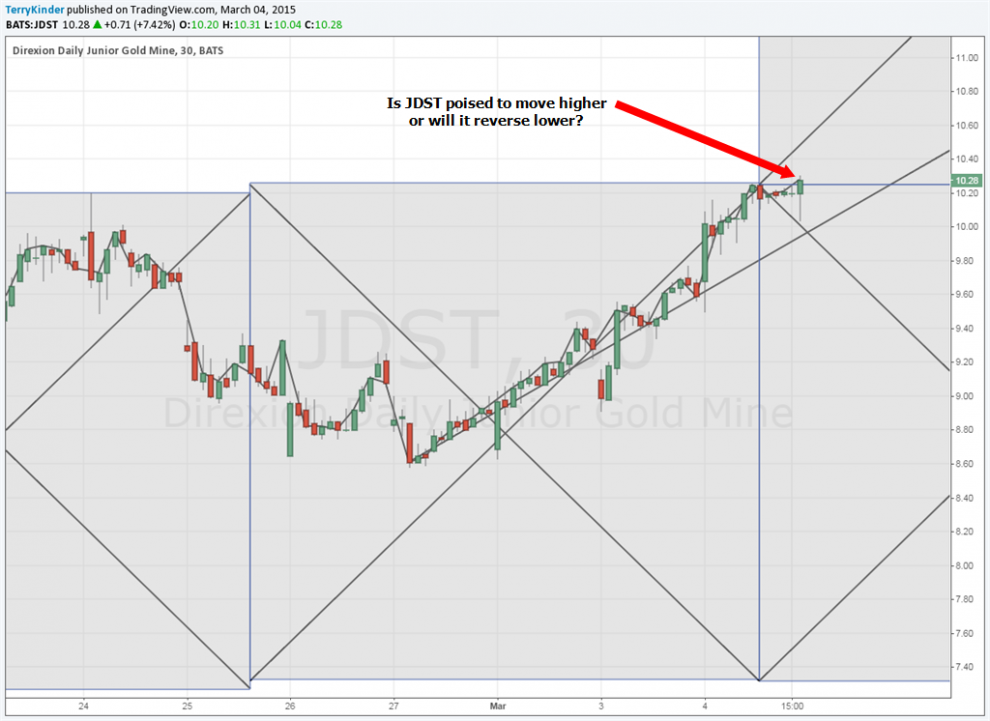
Is JDST poised to move higher?
JDST has made a fairly strong movement higher recently on the back of a slipping gold price. The price of JDST has remained in the upper portion of the square. Each square has been divided in half, and in half again to create four triangles. The JDST price hasn’t been within the lower triangle portion of any square since January which indicates a pretty strong upward price bias. That doesn’t mean JDST can’t reverse lower though.
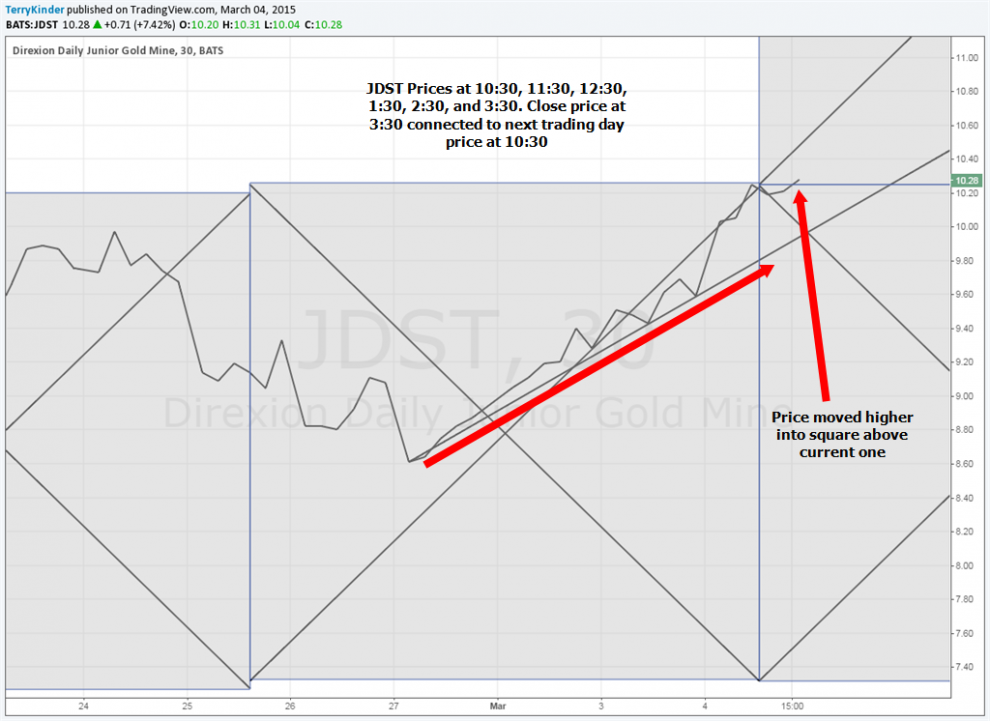
Our previous JDST chart, minus the price bars
A brief note about the chart above. The price line was drawn using the 10:30, 11:30, 12:30, 1:30, 2:30 and 3:30 “closing” prices. The first hour has been left out. This is based on the work of Michael S. Jenkins and his book The Geometry of Stock Market Profits. Although the price did briefly rise higher, entering the square above it, it has since come down a bit. However, price is still above the 45 degree line which slopes towards the lower right hand corner of the square (not visible). Still, overall, JDST is exhibiting a strong tendency to move higher while gold is having a difficult time moving above $1,208.00. Should gold be unable to take and hold $1,208.00 on a weekly basis, this week, it sets up the possibility of the price moving lower to $1,191.00.
Gann Square of 90
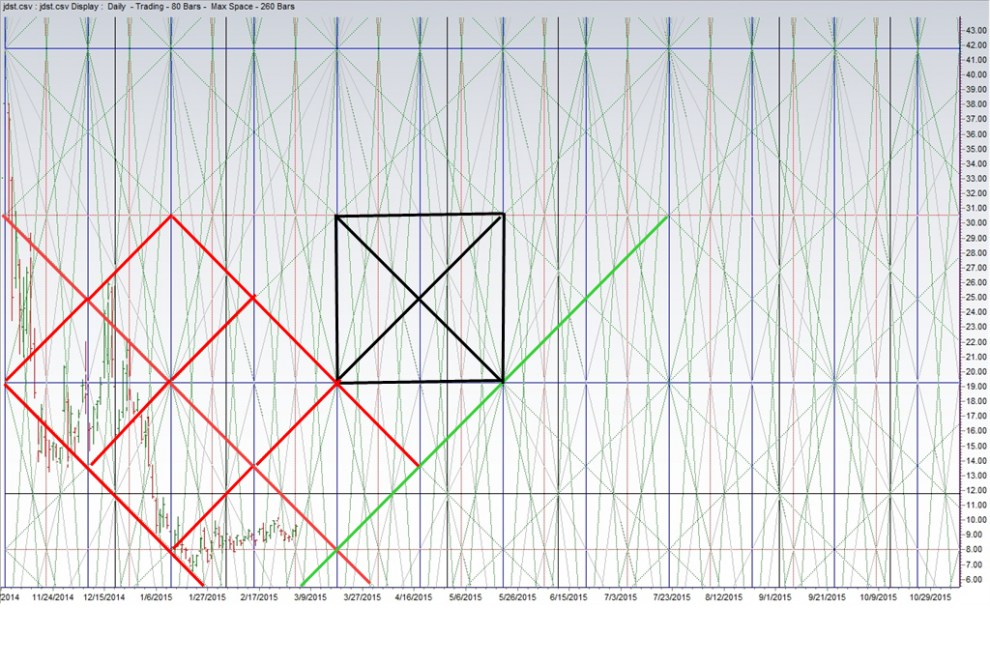
Looking at the Gann Square of 90, the JDST price looks like it could continue moving higher
First off, my apologies that the Gann Square of 90 is difficult to look at. However, if you can get past how much is going on and look at the larger patterns, it’s worth taking a look at. Within the larger pattern, there are a few noteworthy things:
1) The JDST price has generally been moving lower for the past several months but recently caught a bit of a bounce higher. You can see this by following price in the lower left quadrant of the screen shot;
2) The area outlined in red forms a downward price channel with price reaching up toward the mid-line. Should price break above the mid-line we could see it rise further;
3) If you’ll look at the red highlighted area you may notice it forms a diamond pattern. These diamond patterns throughout the chart come in handy. For example, as price moves higher, you can look for the price to move from a diamond lower on the chart to one higher on the chart. This gives you an idea about upward price momentum. The same is true should price move from a higher diamond to a lower one;
4) There are a number of square patterns on the chart. I have highlighted one in black. The square is divided in 4 sections by intersecting 45 degree lines. This is useful to establish trends. Where the lines intersect represents a 50% retracement point where we often see upward price momentum reverse and fall to;
5) A green upward sloping line has been highlighted on the chart. That line could form potential support for the JDST price should it continue trending higher.
Conclusion
JDST has been trending higher while the gold price has been slightly down to flat recently. The inability of the gold price to rise and hold above $1,208.00, on a weekly basis, is troublesome and could mean the gold price will slip to $1,191.00. Should $1,191.00 fail to hold, then gold could visit $1,174.00
Barring a sudden change of trend, it appears that JDST will continue to move higher while gold slips lower. There may not be a serious slippage in the gold price. We’ll just have to see. The failure of gold to capture and hold $1,208.00 this week could mean gold will spend some time below $1,200.00.
Bullion.Directory or anyone involved with Bullion.Directory will not accept any liability for loss or damage as a result of reliance on the information including data, quotes, charts and buy/sell signals contained within this website. Please be fully informed regarding the risks and costs associated with trading in precious metals. Bullion.Directory advises you to always consult with a qualified and registered specialist advisor before investing in precious metals.


