

Did you notice that for the HUI Index, GDXJ, and silver, 2023 is already a down year?
 Bullion.Directory precious metals analysis 08 August, 2023
By Przemysław K. Radomski
Founder of GoldPriceForecast.com
In today’s analysis, I’ll dig into the former. Remember how I wrote in mid-July that after the weekly reversal, junior mining stocks were likely to move lower?
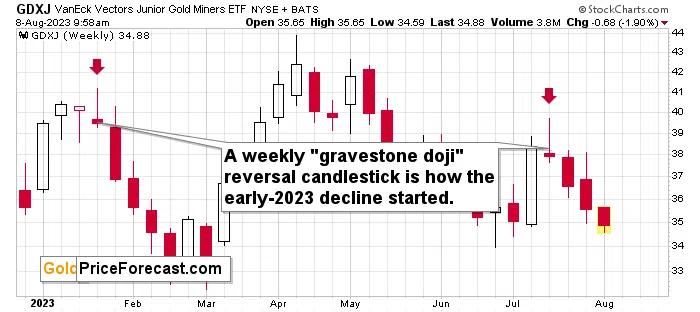

As you can see on the above chart, that’s exactly what happened. At the moment of writing these words, the GDXJ is trading below $35, and it seems that the pace of the decline is picking up. Those, who took advantage of my warnings, are likely happy with this course of events, and those with profitable short positions in the GDXJ are happy to see them grow.
Let’s zoom out to see how big the downside potential really is.
History tends to repeat itself. Not to the letter, but in general. The reason is that while economic circumstances change and technology advances, the decisions to buy and sell are still mostly based on two key emotions: fear and greed. They don’t change, and once similar things happen, people’s emotions emerge in similar ways, thus making specific historical events repeat themselves to a certain extent.
For example, right now, gold stocks are declining – and correcting – similarly to how they did in 2008 and in 2012-2013.

The HUI Index is declining along the green dashed line, which is copied from the pace of the 2012-2013 decline – so both declines are in tune. That’s not bullish at all, given what followed in 2013…
The Stochastic indicator just moved higher from below 20, which might be viewed as a buy signal, but please note that we saw the same thing during both: the 2008 and 2012/2013 declines and it marked just a correction and not a true buying opportunity.
In particular, the move that we saw in 2012 was quickly invalidated and followed by bigger declines. In fact, after this correction, the decline accelerated. So, not, it’s not bullish, as it’s part of a bigger bearish picture.
For many months, I’ve been writing that the situation in the HUI Index is analogous to what we saw in 2008 and in 2013. Those declines were somewhat similar, yet different, and what we see now is indeed somewhere in between those declines – in terms of the shape of the decline.
At first, the HUI Index declined just like it did in 2013, and the early 2022 rally appears to be similar to the late-2012 rally. However, the correction that we saw recently is also similar to the late-2012 rally.
Since history doesn’t repeat itself to the letter but rhymes, is it really that odd that we now see two corrective upswings instead of one? Not necessarily.
This is especially the case given that the 2008 decline had one sizable correction during the big decline. It’s not clearly visible on the above chart due to the pace of the 2008 slide, but it’s definitely there. You can see it more clearly in one of the below charts.
So, no, the recent rally is not an invalidation of the analogies to the previous patterns, it continues to rhyme with them in its own way. And the extremely bearish implications for the following months remain intact.
Let’s take a journey to 2008.
You see, when we’re looking at the 2008 performance, or when we’re just thinking about it, we’re seeing the huge slide, and that’s pretty much all there is to it. Everything else gets tuned out as it’s not even comparably visible.
However, before the decline materialized, it was… well, not present at all. Nobody knew that it was just around the corner. Nobody “felt” the despair or the urgent need to sell mining stocks before they declined. And practically everyone felt this “need” after the prices were already low and it was time to buy (the irony…).
Today’s journey to 2008 is about looking at what everyone saw in July. Please imagine what everyone felt at that time.
The GDX ETF was after a several-month-long rally, and it just reversed, but it didn’t seem like a big deal at all. The short-term uptrend seemed strong.
The bulls were happy and confident at that time. The financial system had problems, as did the real estate market (nothing big, though – or so it seemed). Gold and gold stocks seemed like a solid bet – they are hedges against uncertainty, after all. Right?
The sentiment was very positive.
Math aligns with all the above: the GDX ETF was after a nice 60%+ run-up starting from its recent bottom.
The RSI was at about 70, but… Surely, miners were about to rally even more. Right?
Wrong.
Oh, so wrong.
What you see on the above chart was the final immediate-term high that preceded the unthinkable.
The GDX ETF plunged below $15. That’s about one-third of the most recent high and about half of the low from which this “big 60%+” corrective rally started.
Fast-forward to the current situation.

The GDX ETF was after a nice 71% run-up from its recent low.
The sentiment was very positive.
After all, gold and gold stocks were going to rally during uncertain times in the banking sector. Right?
It didn’t matter that the RSI is above 70 and many other indications (even crude oil’s behavior) resemble what happened in 2008, right?
And it didn’t matter that GDX just formed a daily shooting star reversal candlestick on huge volume, which is a classic sell signal, right?
So, it was a great idea to be bullish at that moment. Right?
Wrong.
I know it “felt right” to be bullish at that time, but it was exactly the same thing before the slide started in 2008. This is what makes it so difficult to make money in the long run – to stay focused on what’s likely to happen and not follow the general sentiment.
GDX’s move back below its early-2023 high confirms the very bearish outlook.
How low can the HUI Index fall during the next big downswing?
As is the case with gold and silver, a move back to the 2020 lows is definitely in the cards. Please note that this level is also strengthened (as support) by other major lows: 2019, 2014, and 2008 ones.
However, I wouldn’t rule out a move even lower on a temporary basis. If gold were to decline to about $1,450-1,500, it would mean that it would double its current 2022 decline. If the HUI Index does that, it will move below 150.
So, all in all, 80-120 is my current target area for the upcoming slide in the HUI Index.
What about the short run?
Back in April, the RSI was just pointing to GDXJ being most overbought IN YEARS. Literally.

That was the top – probably the yearly top and the start of an enormous decline.
Also, please note that the GDXJ is below the final close of 2022, which means that as of today, 2023 is a down year for junior mining stocks – despite both: gold and stocks being higher than they were at the end of Dec. 2022.
What’s particularly interesting is that this yearly top was preceded by the lower-than-expected nonfarm payroll statistics – just like what we saw over three weeks ago and just like what we saw on Friday.
Back then (after the report was released), I wrote that the implications were very bearish for the following weeks, even if we saw a small move higher in the immediate aftermath. It wasn’t clear if the rally would be notable (like in 2022) or not (like at the 2023 top). It was notable, but it seems that the rally is completely over and that now the real move is starting.
The huge volume that accompanied the recent declines confirmed the bearish scenario.
Interestingly, the situation that was more similar to the current one due to the size of the recent rally – the April 2022 price action – was what preceded the huge slide during which the price of the GDXJ was approximately cut in half.
Dividing the recent top’s price by 2 provides us with $20 as the target, but it seems that we might see at least a short-term corrective upswing when the GDXJ moves back to its 2022 low at about $26.
Will we see a rebound from the previous 2023 low at about $33 as well? It’s a tough call right now. We might see it, but – given the size of the rally that we saw from $34 – it’s not a sure bet. We’ll see more when we get there, and I’ll keep you – my subscribers – informed.
The 2022 low (at about $26) is also the target that we get when we consider the head and shoulders formation (the blue line is the neck level), which makes it even more likely that this price is going to be reached, and that we’ll see some kind of corrective upswing from there.
Either way, it’s best to monitor the markets for new signals as we move toward $33. And that’s exactly what I’m going to do – and I’m going to report to my subscribers accordingly.
Przemyslaw Radomski


Przemyslaw K. Radomski, CFA, has over twenty years of expertise in precious metals. Treating self-growth and conscious capitalism as core principles, he is the founder of GoldPriceForecast.com
As a CFA charterholder, he shares the highest standards for professional excellence and ethics for the ultimate benefit of society and believes that the greatest potential is currently in the precious metals sector. For that reason it is his main point of interest to help you make the most of that potential.
This article was originally published here
Bullion.Directory or anyone involved with Bullion.Directory will not accept any liability for loss or damage as a result of reliance on the information including data, quotes, charts and buy/sell signals contained within this website. Please be fully informed regarding the risks and costs associated with trading in precious metals. Bullion.Directory advises you to always consult with a qualified and registered specialist advisor before investing in precious metals.


Leave a Reply