

A stronger dollar, represented by the US Dollar Index (DXY) has exerted downward pressure on the price of gold
 Bullion.Directory precious metals analysis 16 September, 2014
By Terry Kinder
Investor, Technical Analyst
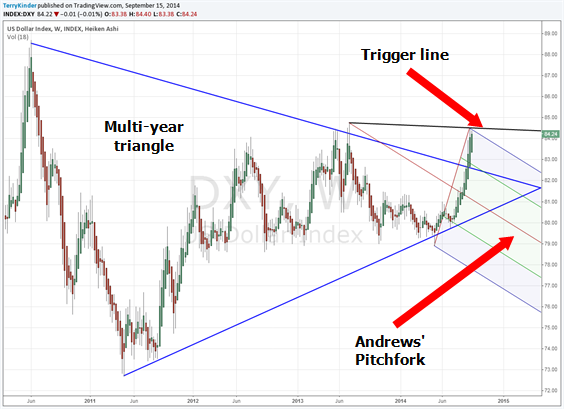
The US Dollar Index (DXY) broke out of a triangle and has continued to move higher.
In the above chart, the US Dollar Index (DXY) price broke out of a triangle pattern on the weekly chart earlier this month, and has continued to move higher. What isn’t readily apparent, however, is whether or not the upward price momentum will continue. One way to get a better idea is to draw an Andrews’ Pitchfork on the chart. In this case we have drawn the pitchfork high-low-high ($84.75-$78.90-$84.51). Then, we draw a trigger line from the first high to the second high, where the $84.51 touches the upper parallel line of the pitchfork. This trigger line, if the US Dollar Index (DXY) price crosses above it, indicates that the price will likely continue higher. However, the normal expectation is that price – after touching the upper parallel line – will bounce off it and move lower toward the red-colored median line. Alan Andrews said that price – once it reached either the upper or lower parallel line – would return to the median line about 80% of the time. This would point to a fairly good probability that the US Dollar Index Price (DXY) could moderate lower, at least for a time.
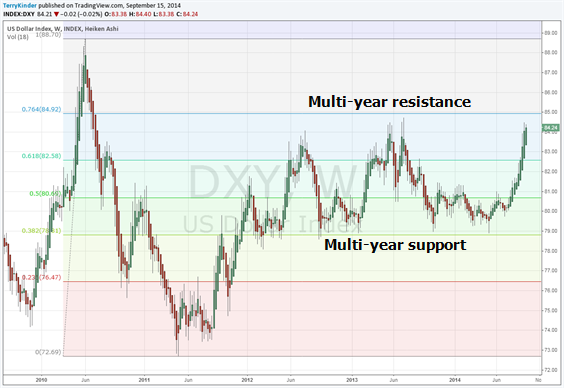
US Dollar DXY Fibonacci Retracement levels show multi-year resistance near $85.00 and multi-year support near $79.00
Fibonacci retracement multi-year support and resistance levels indicate that the US Dollar Index (DXY) will encounter significant resistance as the price nears the $85.00 level. The last time the DXY was above the $85.00 level was during the week of 7-5-2010. As with the Andrews’ Pitchfork, the Fibonacci retracement level of 0.764 ($84.92) hints that price may, at least temporarily, moderate to the downside.

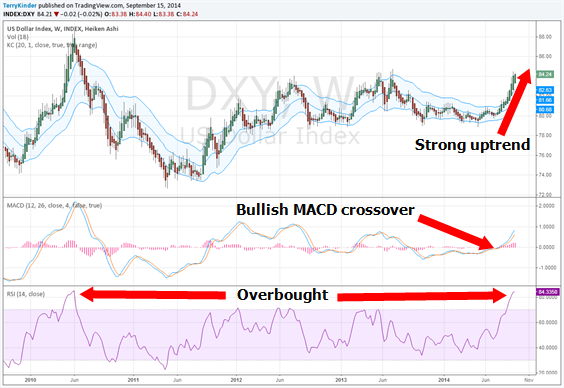
US Dollar Index (DXY) Keltner Channels indicate upward price momentum for the dollar
The Keltner Channels for the weekly US Dollar Index (DXY) chart show strong upward price momentum as price has risen above the channels. A bullish crossover of MACD occurred in July. RSI (Relative Strength Index) is overbought at levels not seen since the middle of 2010. Should RSI begin to turn down, in combination with weaker MACD and/or the Heiken Ashi candles turning red and falling back toward the Keltner Channels, then that would be a strong signal that the US Dollar Index (DXY) was beginning to move lower.
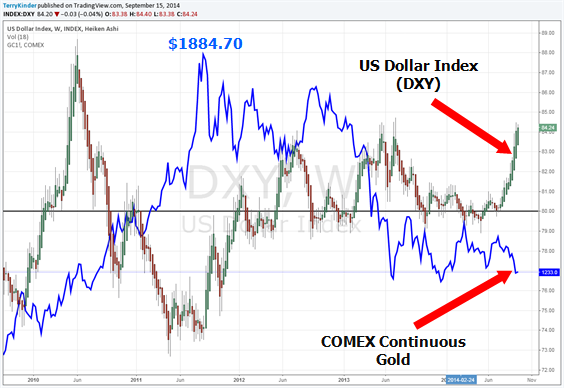
US Dollar Index (DXY) and COMEX Continuous Gold overlay shows how much of the time the dollar and gold move in opposite directions
The final chart above is the US Dollar Index and Continuous COMEX Gold overlay. The Heiken Ashi candles are for the DXY and the blue line is COMEX Gold. As you can see, DXY and gold often move in opposite directions. So, COMEX Gold strength provides a mirror image of US Dollar Index (DXY) weakness. DXY strength provides a mirror image of COMEX Gold weakness. A black horizontal line is drawn on the chart at the $80.00 which seems to be an important level. When the DXY crosses above $80.00, gold often moves down in price. When the DXY crosses below $80.00, gold often moves up in price.
Conclusion:
The picture for the US Dollar Index (DXY) is mixed. The Keltner Channels show strong upward price momentum. This could possibly last another week or two. The Andrews’ Pitchfork and Fibonacci Retracement level near $85.00 indicate that the dollar is likely to meet strong resistance and its price could moderate to the downside.
Keep a close eye on on the US Dollar Index (DXY) in relation to the Andrews’ Pitchfork and trigger line. Key price levels to watch for on the downside are $83.74-83.82, $81.47-$81.55, and $79.22-79.31. Upside resistance is $84.92-$85.00 and $86.04-$86.13. Most of these number are based on the Gann Square of Nine, but that is a subject for another day.
Bullion.Directory or anyone involved with Bullion.Directory will not accept any liability for loss or damage as a result of reliance on the information including data, quotes, charts and buy/sell signals contained within this website. Please be fully informed regarding the risks and costs associated with trading in precious metals. Bullion.Directory advises you to always consult with a qualified and registered specialist advisor before investing in precious metals.


Chart changed to indicate RSI as overbought rather than oversold.
Check the chart. The RSI should read overbought. Nice article though 😀
Good catch. I will change the chart.