

One of the hardest aspects about technical analysis is for analysts to eliminate their own biases.
 Bullion.Directory precious metals analysis 8 September, 2014
By Terry Kinder
Investor, Technical Analyst
A good example of this came up recently in the article, I Am Re-Iterating Last Week’s “Buy” Signal In Mining Stocks. First off, a word of advice. Beware of analysts bearing buy signals. But seriously, a couple of quick points before moving on:
Essentially, the article recommending buying mining stocks, did so for four reasons (Have only taken the first sentence or so from each one. Please go to original article to see reasons in full):

1) The Marketvane gold and silver investor sentiment readings hit levels not seen since June 2013;
2) The HGNSI (Hulbert Gold Stock Newsletter Index) dropped to -32. This is a near-perfect contrarian indicator;
3) For the first time ever, I received a “hate” email;
4) Perhaps the most telling indicator is the trading action in JNUG.
The article, like many you will see, is in fact, a combination of technical analysis (or at least charting) with other points. For example, citing “hate” email to confirm that “we’re bottoming” seems a bit of a stretch. Other points – the Marketvane gold and silver sentiment readings and the Hulbert Gold Stock Newsletter Index – may be useful, but may not either by themselves, or combined together, be able provide any clear signal whether or not to buy mining stocks.
The fourth point, the trading action in JNUG, is more in line with technical analysis, but it displays the author’s biases when the author writes:
From this graph you can see definitive rising volume during the sector’s move higher from early June, and definitive declining volume during the manipulated sell-off. It would appear that on Thursday we saw “capitulative” selling from people like the Merrill Lynch financial adviser. Rising volume on moves higher, followed by declining volume on sell-offs is typically bullish.”
Whether one believes in price manipulation or not, it isn’t relevant to technical analysis offered by the author. Technical analysis is about looking at the price, patterns, and indicators to help predict future price direction and momentum. Assuming that manipulation is the reason for the price drop in JNUG bring bias into the analysis. The fact is that JNUG (and the GDXJ for that matter) displays a fairly regular price cycle. JNUG is in the process of bottoming and will likely do so within the next two weeks or so. So the price pattern of JNUG is much more relevant to the technical analysis than manipulation is. Manipulation might be more relevant had the author used charts, patterns, and other indicators to demonstrate manipulation.
In addition, while the term “capitulative selling” may seem enlightening, it is actually fuzzy and imprecise. Why? Well on Thursday, September 4th – the day of “capitulative selling”, price opened at $22.30 and closed at $18.59. Then, on September 5th, price opened at $18.74 and closed at $19.81. Capitulation accomplished? Well, today, September 8th, price gapped down on open to $19.10 and is down over 15% to $16.79 as this is being written. Fuzzy terms may sound good. We may like and feel good when people agree with our point of view. Unfortunately, none of this make us better investors. It doesn’t indicate when we should consider buying or selling, which way the price is moving, or how quickly.
So, what are some ways technical analysts can insure their technical analysis is free from biases?
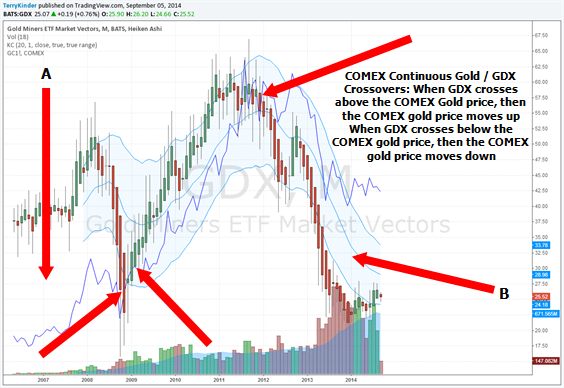
1) Attempt to illustrate with graphs and charts the relationships that are said to have an influence on one another. An example of that can be seen here in attempting to define the relationship between COMEX continous gold and the GDX ETF. It isn’t enough to know or believe that one thing influences another. You have to make an effort to demonstrate the relationship so others can see what you are talking about and come to their own conclusions;
2) Don’t let your own biases influence your analysis. Whether or not you believe, or even have what you believe to be proof, that prices are manipulated, how is that relevant to analyzing prices? If you assert that prices are manipulated, then it is that much more difficult to turn around and say you are going to analyze prices. You can analyze prices and accept there may be some error due to manipulation or, you can attempt to define the influence of manipulation on prices and adjust for it. But, to do that, you are going to have to show how manipulation affects price specifically and explain how you can properly correct for it;
3) Don’t let outside factors enter into your analysis. Point number three in the mining stock buy signal analysis – the “hate” email – is a factor completely outside the realm of technical analysis. While strong disagreements can often lead analysts to believe strongly they are on the right track, it should also cause them to double-check their work to insure there are no mistakes. Some of this will depend on the contents of the “hate” email. Does the email make any point or is it just a bunch of insults? Often, if you present enough facts in the proper manner, rebuttal is extremely difficult. So, when the opposing side lacks facts, they hurl insults instead;
4) Be able to offer some price target, or other trigger, when discussing price. It isn’t enough in technical analysis to merely point to a price or indicator and say that, “This is the top,” or, “This is the bottom.” It is better if you can point to several factors, such as price, multiple indicators and/or a pattern that, when seen together, will indicate a price has topped or bottomed. At a minimum, offer some price levels, or ranges, that will act as guide posts so the reader can have an idea that they are nearer or farther from the goal. Perhaps a bullish or bearish crossover of RSI is necessary before buying or selling.
Provide context so the investor can see and judge for themselves whether or not your technical analysis is accurate and without biases.
Bullion.Directory or anyone involved with Bullion.Directory will not accept any liability for loss or damage as a result of reliance on the information including data, quotes, charts and buy/sell signals contained within this website. Please be fully informed regarding the risks and costs associated with trading in precious metals. Bullion.Directory advises you to always consult with a qualified and registered specialist advisor before investing in precious metals.


I believe the problem is that the vast majority of analysts are merely pushing their own agenda. Well, if one is bullish on equities, why in the world would they point to conflicting data, technical or otherwise?
Also, outside information is important, while hate mail is not. I am a technician by trade, and find price to be key when trading. Although, it would be important for a technician to include fundamental analysis, for instance, into their analysis and forecasting. Fundamentals, news, headlines, or “manipulation” will move price. The cause of the move, to me, is irrelevant. Now, that it is at the current price, it’s my job to determine where it could go and when. Bais removed, I have a long and short scenario to take advantage of price action.
You bring up very good points.
Christopher, I agree with you. Fundamentals, news, headlines, etc. are important. I believe that those things are encapsulated by the price and that price is the only information necessary to produce sound technical analysis