

What if the strong dollar is a trend and not a fluke?
 Bullion.Directory precious metals analysis 22 September, 2014
By Terry Kinder
Investor, Technical Analyst
Is the strong dollar becoming a trend?
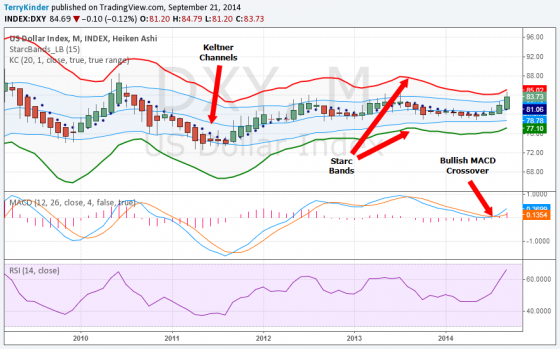
Looking at the monthly chart of the US Dollar Index (DXY) chart above there are some noteworthy features:
1) Price of the dollar has moved from a low of $72.69 during the week of 5-2-2011 up to a high of $84.79 during the week of 9-1-2014;

2) The dollar price on a monthly basis is moving above the Keltner Channels. The last time this happened back in 2010 the dollar did move lower. However, should the dollar be able to put back to back months above the Keltner Channels, it could be the beginning of a stronger trend higher;
3) A bullish MACD crossover occurred around July and the dollar moved from a low of $79.74 to over $84.00 presently;
4) The dollar price is approaching the Starc + band (upper red band). This can be a signal of a reversal lower. However, it is not uncommon to have several months in a row (2-3 with the dollar) where the price touches or moves above the Starc + band. You can also see multiple touches of the Starc + band, with periodic movements of price lower, within a long-term price uptrend.
So, by no means is the case for a strong dollar a sure thing based on the monthly chart of the DXY. A little later we’ll take a look at some patterns which, if seen on the chart, would support the case for a strong dollar.
So, what about the case for weaker gold?
Does the weaker gold price imply a strong dollar?
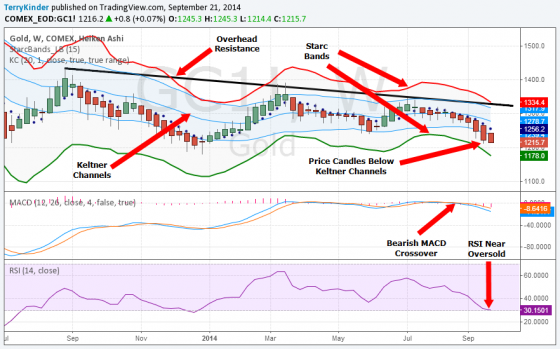
The COMEX continuous gold price has several elements that are negative for gold:
1) For the past year or so, gold has failed to decisively move above the black overhead resistance line on the weekly chart;
2) The gold price has fallen below the Keltner Channels. This indicates strong downward price momentum;
3) A bearish MACD crossover occurred during August.
Other points of interest worth watching on the chart:
1) The Starc + (red band) is getting close to entering into the upper Keltner Channels. Should this happen it would be an indicator of further downward price momentum;
2) RSI is nearing oversold. By itself this doesn’t mean that the COMEX continuous gold price will go up.
However, should MACD reverse higher, then there is potential for at least a brief upward bounce in price. Consider a move higher in price a possibility, but not a high probability move.
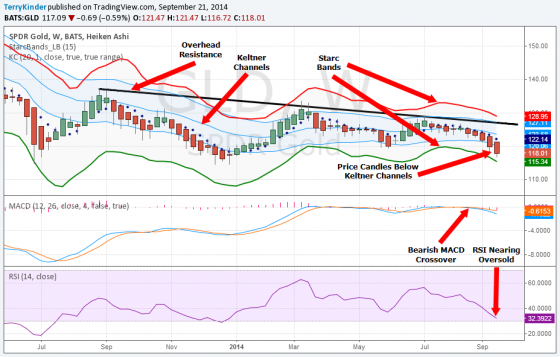
For another slightly different view of gold we can look at GLD.
Is a weakening GLD indication of a strong dollar?
1) Similarly to COMEX continuous gold, GLD has failed to break above overhead resistance decisively on the weekly chart;
2) The GLD price has fallen below the Keltner Channels. This indicates strong downward price momentum;
3) A bearish MACD crossover occurred in the GLD during August.
The other points of interest in the GLD are similar to those for COMEX continuous gold:
1) The Starc + (red band) is approaching the upper Keltner Channels. Should this happen it would be an indicator of further downward price momentum;
2) RSI is nearing oversold. GLD is not as near to oversold as COMEX continuous gold is. By itself this doesn’t mean that the GLD price will go up, but should MACD reverse higher then there is potential for at least a brief upward bounce in price. Consider it a possibility, but not the highest probability move in the gold price.
So, what would be some signs to look for that would indicate a strong dollar trend?
1) The Starc – (minus) band enters into the lower Keltner Channels on the monthly chart. This has already occurred on the weekly chart (not pictured). If it occurs on the monthly DXY chart it could indicate a strong multi-month move upward of the dollar price;
2) An entire price candle body or candle bodies move(s) above the Keltner Channels. This would indicate even stronger upward price momentum;
3) A narrowing of the Starc Bands followed by a move up in the DXY price. The Starc Bands often narrow before a strong move up or down in price.
While it isn’t yet clear that we are looking at a strong dollar which can continue its upward price momentum, we should watch the price trend, and indicators, as they will strongly influence whether or not we see weaker gold prices or not.
Bullion.Directory or anyone involved with Bullion.Directory will not accept any liability for loss or damage as a result of reliance on the information including data, quotes, charts and buy/sell signals contained within this website. Please be fully informed regarding the risks and costs associated with trading in precious metals. Bullion.Directory advises you to always consult with a qualified and registered specialist advisor before investing in precious metals.


Leave a Reply