

Analysis can give a simple road map to investors as shown by this SLV chart
 Bullion.Directory precious metals analysis 1 September, 2014
By Terry Kinder
Investor, Technical Analyst
Simplicity is prerequisite for reliability.
– Edsger Dijkstra

Ironically, it took a rocket scientist, and a mainframe computer, to reveal the elegant simplicity of price cycles seen everywhere. His work has been simplified by Tradingfives in their book, JM Hurst Cycle Trading Without the Rocket Math. What follows is based on ideas from that book using my own chart of SLV as an example.
SLV, an ETF tracking the price of silver, is often used in technical analysis as it is considered a good proxy for the price of silver.
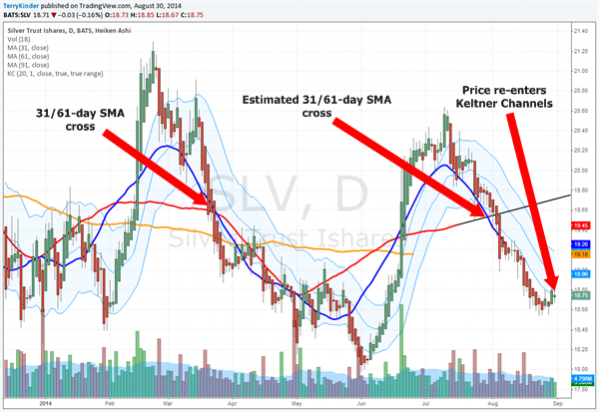
On the investor road map of SLV, the displaced Simple Moving Averages (SMA’s) are the roads which will guide the investor’s capital safely to its final destination.
Drawn on the SLV chart are three Simple Moving Averages of 31 (blue line), 61 (red line), and 91 (orange) days. These SMA’s are then moved to the left by half the SMA (and rounded up) – 16 days for the 31-day, 32 days for the 61-day and 46 days for the 91-day SMA. Where the SMA’s cross each other – especially the 31-day and 61-day – often marks the half-way point of either a move up or down in price. When the SMA’s cross that allows the investor to estimate the next turn (or pivot) in price. Examples from the chart follow below.
The first example is labeled “31/61-day SMA cross”. This cross occurred at $19.52. The pivot high was $20.88. The math is as follows:
$20.88 (pivot high) – $19.56 (SMA crossover) = $1.32.
$19.56 (SMA crossover) – $1.32 (difference between pivot high and SMA crossover) = $18.24 (estimated pivot low).
What was the actual SLV pivot low price? $17.98. Pretty close.
The second example is labeled “Estimated 31/61-day SMA crossover”. Because the SMA’s have been moved to the left on the chart, you have to estimate where the future crossover will take place. To do so you draw the future path of the SMA (in this case the 61-day) along the same path it is currently traveling on. The math is as follows:
$20.64 (pivot high) – $19.54 (SMA crossover) = $1.10.
$19.54 (SMA crossover) – $1.10 (difference between pivot high and SMA crossover) = $18.44 (estimated pivot low).
What was the most recent SLV low (and likely pivot low)? $18.54.
The technique is so simple, it feels like cheating. You don’t have to be a rocket scientist like JM Hurst to do the math. The only math required can be done the old school way with paper and pencil. The charting program used, Trading View is free, and will allow you to make charts, move the SMA’s as outlined above and much more.
Note: Keltner Channels have been added. Since price tends to move to the top of the channels, and then back down to the bottom, the channels tend to support the accuracy of the turns revealed by the SMA crossovers.
The technique outlined above is both simple and reliable. It isn’t perfect. Nothing is. On occasion it may point to a pullback or consolidation rather than a pivot. In practical terms, how does this analysis of the SLV price relate to silver?
There is a good chance SLV (and the silver price) will move up in price, for now, as SLV looks to have made a low at $18.54.
Bullion.Directory or anyone involved with Bullion.Directory will not accept any liability for loss or damage as a result of reliance on the information including data, quotes, charts and buy/sell signals contained within this website. Please be fully informed regarding the risks and costs associated with trading in precious metals. Bullion.Directory advises you to always consult with a qualified and registered specialist advisor before investing in precious metals.


Terry,
Great way to touch on how simplicity is key. A clean chart is an accurate chart 😉
Christopher, thank you. Definitely believe simplicity is the way to go whenever possible. The simplest illustrations and explanations are usually the best ones.