

Can Cycles help us know the future price of silver?
 Bullion.Directory precious metals analysis 1 September, 2014
By Terry Kinder
Investor, Technical Analyst
Each thing is of like form from everlasting and comes round again in its cycle.

Edward Russell Dewey, founder of the Foundation for the Study of Cycles (FSC), when asked what sorts of cycles the Foundation studied, replied:
“Rhythmic occurrences and fluctuations…The tendency of events to repeat at more or less uniform time intervals. Cycles occur in everything- in the pulsations of distant stars, in the prevalence of sunspots, in weather conditions, in the abundance of mammals, birds, insects, and fish, and in the prices of securities. In fact, they occur almost anywhere you look in nature or social activity. Why is that?
It’s easy to reject the idea of price cycles. Predicting future prices based on cycles seems far fetched. However, try and keep an open mind while we look at a few examples.
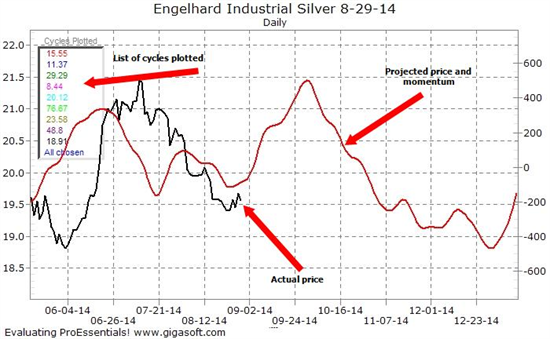
The silver price, as represented by Engelhard Industrial Silver, pictured with the actual price and the projected price and momentum.
The chart above is for Engelhard Industrial Silver. The solid black line represents the actual price. The red line represents the projected price and momentum. The graph above was created by Techsignals software. The software pulls price cycles out of price data, then combines those cycles into what you see as the red line. (Techsignals is available at the FSC site. You must join as a free member to download it. Note: This is not a recommendation to join FSC nor is it an endorsement of the work of the FSC).
You should not mistake the red line for the exact path the price will take in the future. Instead, it indicates the potential strength and direction of price in the future. The chart seems to indicate that the silver price will follow its normal seasonal pattern higher during the month of September. However, from October through December it looks like the price will go down.
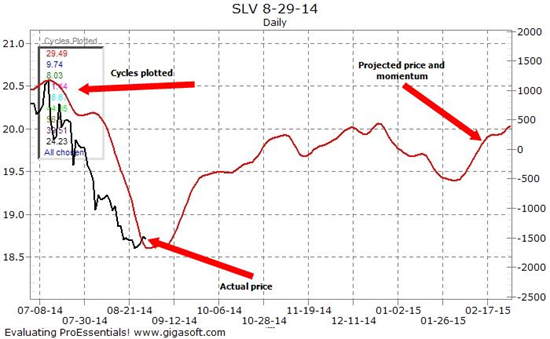
SLV – often used as a proxy for the silver price – appears that it could rise in price from now until the end of the year. However, it doesn’t appear to be a big move when compared to the price and momentum line on the left-hand side of the chart.
In the above chart SLV is used as a stand-in for the silver price. The red line hints that the SLV price may move higher during the rest of 2014. But, when compared to the price move down from July to August, the move up at the end of the year looks weak.
The above charts suggest that the silver and SLV prices may not move in the same direction. Most of the time the SLV and silver prices move together. In the chart below, the candlesticks represent the SLV price and the blue line is the Engelhard Industrial Silver price.
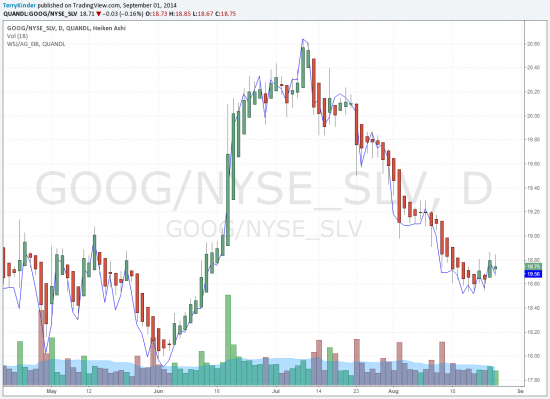
Typically, the silver price – represented by the Engelhard Industrial Silver price – and the SLV track each other fairly closely. The candlesticks represent the SLV price and the blue line represents the Engelhard Industrial Silver price
Below is a list of reasons why the SLV and Engelhard Industrial Silver prices look like they may not be moving in the same direction:
- The SLV future price plotted is wrong
- The Engelhard Industrial Silver future price plotted is wrong
- Both charts of the future price plot are wrong
- The red future price line on the SLV chart is wrong because the time period selected is wrong
However, after looking at the SLV chart again and adjusting the dates, the future price line looks okay.
So, it looks like one or both (SLV and Engelhard Industrial Silver) charts is wrong about future prices, or the difference between the two prices will be larger than normal during the last few months of this year.
Bullion.Directory or anyone involved with Bullion.Directory will not accept any liability for loss or damage as a result of reliance on the information including data, quotes, charts and buy/sell signals contained within this website. Please be fully informed regarding the risks and costs associated with trading in precious metals. Bullion.Directory advises you to always consult with a qualified and registered specialist advisor before investing in precious metals.


Leave a Reply