

We cover the angles that will give you the inside angle on the high and low prices for silver
 Bullion.Directory precious metals analysis 9 April, 2015
By Terry Kinder
Investor, Technical Analyst
What if it were possible to have the inside angle to know the high and low prices for silver? Well, with a few simple angles, you can get an accurate idea of where price support and resistance will be seen on the silver chart years ahead of time.
We have discussed many times before how price is governed by the same universal laws that govern physics, mathematics and geometry. Utilizing these laws and geometric patterns, we can discern any number of important angles of support and resistance within price charts that will allow us to see potentially important points of price support and resistance many years into the future. This can be demonstrated utilizing a single monthly chart of the silver price.
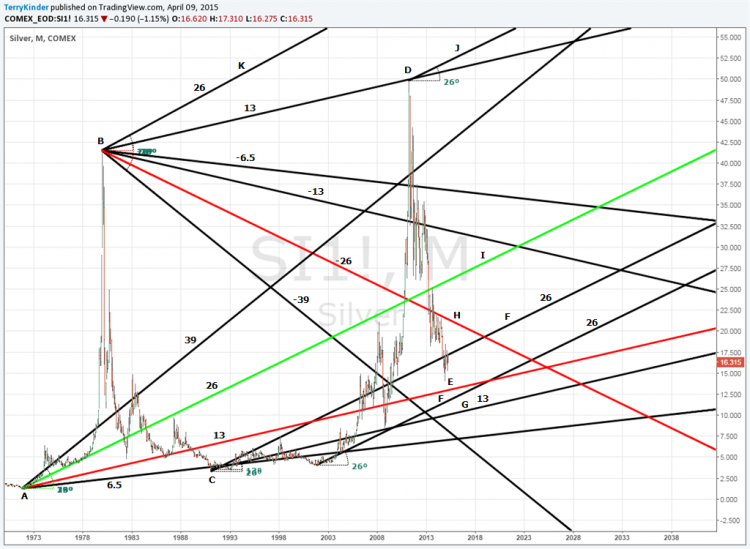
Beginning with the 26 degree angle, we can determine important price support and resistance levels years ahead of time.
One of the fundamental errors committed in constructing price charts is selecting a starting point that is not an important high or low price. Preferably, when creating a price chart, the all time high or low price (or both) should be used. Nothing is accomplished by cherry picking a starting point to twist and contort the price information to agree with some personal bias about where price is headed.

Support and resistance lines, based on the 26 degree angle, can provide clues to price support and resistance many years into the future. Image: pixabay
There are a good many points noted on the chart and we aren’t going to cover all of them in the interest of time. However, there are several noteworthy features on the chart that are well worth looking at more closely.
1. Starting at point A and drawing a 6.5 degree angle, you would have been able to buy silver very near it’s low of $3.505 at point C;
2. Utilizing a 13 degree angle from the $41.50 high of January 1980, you could have nearly top ticked the April 2011 silver high of $49.82;
3. The 13 degree angle drawn from point C would have had you buying silver at the low of $8.40 in October 2008;
4. The 39 degree angle drawn from point A would have warned you to exit both near the 1983 and 2011 market tops;
5. The intersection of the 26 degree lines drawn from A and B would have signaled to buy silver at around $23.74 on its way up to over $49.00;
6. The -6.5 and -13 degree angles drawn from point B would have warned you to sell silver;
7. The 26 degree line plotted from point A would have warned you of topping prices in 1987, 2008 and 2013
There is much, much more to consider in the above chart, but that should give you just a taste for what the 26 degree angle, and its related angles, can do to help discover important price support and resistance levels.
It would also be worthwhile looking at points E, F, and G to get an idea of potential support areas, as well as point H as a possible buy trigger at some future date.
You might also consider the 26 degree angles drawn from the silver highs at B and D to get an idea where the silver price could eventually move to in the future.
While hindsight, of course, is 20/20, a knowledge of the important angles based on the 26 degree angle, can provide you with important clues as to future areas of price support and resistance years ahead of time.
Bullion.Directory or anyone involved with Bullion.Directory will not accept any liability for loss or damage as a result of reliance on the information including data, quotes, charts and buy/sell signals contained within this website. Please be fully informed regarding the risks and costs associated with trading in precious metals. Bullion.Directory advises you to always consult with a qualified and registered specialist advisor before investing in precious metals.


Leave a Reply