

Gold triangles point toward the gold price to move as high as $1,240.00-$1,265.00
 Bullion.Directory precious metals analysis 7 April, 2015
By Terry Kinder
Investor, Technical Analyst
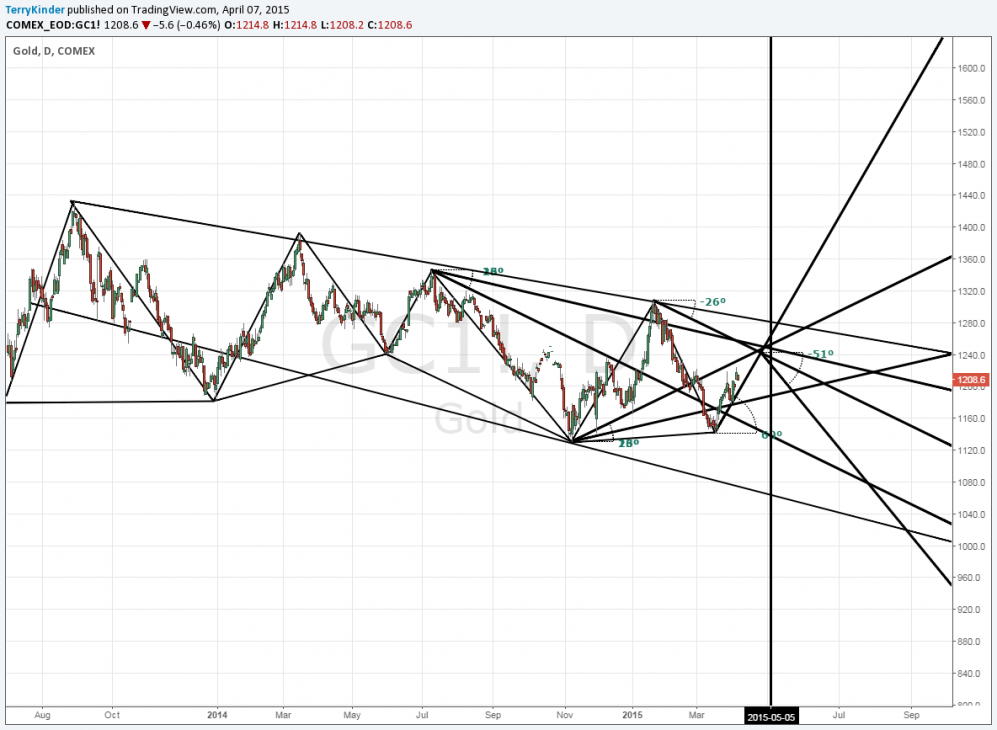
Sometimes it’s good to let a chart alone for a while and see how it plays out. The chart of gold triangles may be just one such chart. Below is the original chart.

Our original gold triangles. In the next chart we’ll propose a revision.
While the original gold triangles may prove accurate, the price action the past few weeks has moved against the fourth triangle above. A fairly sharp move down would be required within the next month or so in order for the fourth and fifth triangles to be correct.
Another potential strike against the original model is gold seasonality.


Gold seasonals tend to point towards lower prices from the middle of May to mid-June
Generally, gold tends to move higher from the beginning of April until the middle of May or so. Given the gold seasonality, the original triangles, which had the gold price declining into early May, don’t reflect the normal seasonal trend. So, below is a revision more in line with seasonality and which also utilizes some additional geometric patterns and angles to predict pivot high and low prices.
Our proposed revision of the gold triangles relies on certain angles – particularly 26 and 13 degrees to determine pivot high and low prices.
As long as the gold price doesn’t plunge below $1,141.60, there is a higher probability that the revised triangles are more accurate than the original ones. If this holds true, then we should expect the gold price to move higher to somewhere between $1,240.00 to $1,265.00 before reversing.
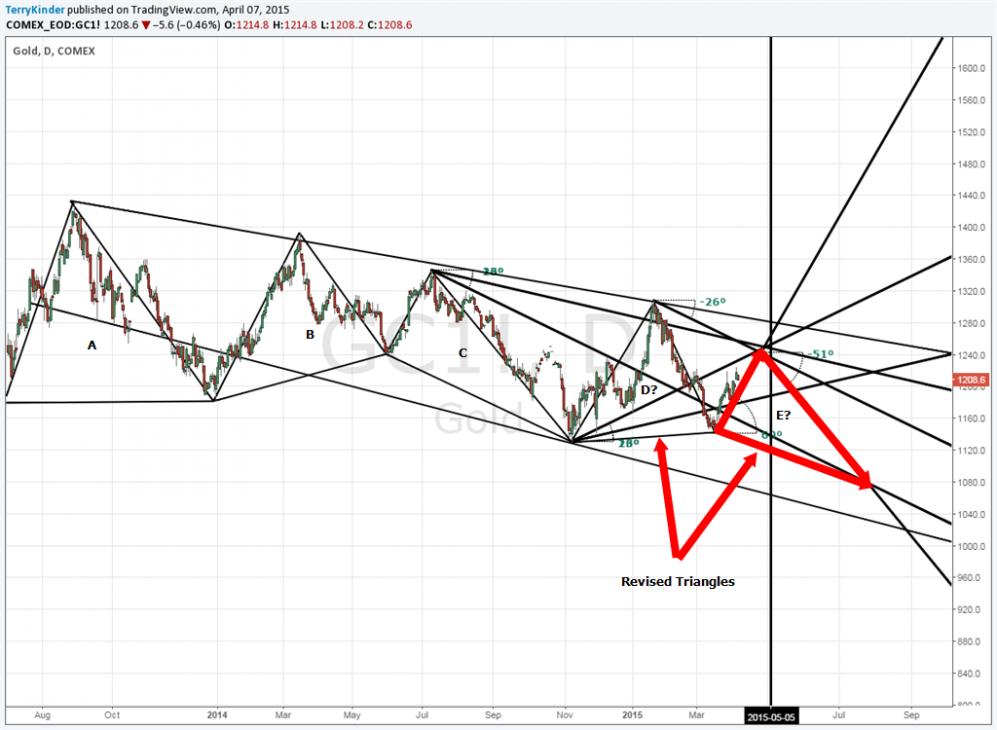
Revised gold triangles highlighted. Pay special attention to the last triangle.
In our last chart, we have highlighted the two revised gold triangles. Pay special attention to that last triangle and where it points to. The 5 May 2015 date is still worth watching as it may prove to be an important reversal, but in the opposite direction from our original analysis.
Barring a sharp reversal below $1,141.60, it’s probable the gold price will move to between $1,240.00 to $1,265.00 before it reverses. Keep an eye out for revised Triangle E and where it points to.
Bullion.Directory or anyone involved with Bullion.Directory will not accept any liability for loss or damage as a result of reliance on the information including data, quotes, charts and buy/sell signals contained within this website. Please be fully informed regarding the risks and costs associated with trading in precious metals. Bullion.Directory advises you to always consult with a qualified and registered specialist advisor before investing in precious metals.


Leave a Reply