

It seems that the gold price uptrend has been unstoppable as of late. We’ll look at a chart to see if the strong gold price uptrend might be weakening.
 Bullion.Directory precious metals analysis 19 January, 2015
By Terry Kinder
Investor, Technical Analyst
What goes up must come down, or it least so goes the truism. In recent days the gold price uptrend has been pretty much all up and no down. Although that would suit me just fine, let’s take a look a a chart and see if there are any signs that the gold price uptrend might be weakening a little.
Gold Price Uptrend Weakening? Even just looking at the technicals, gold has looked quite strong.
There are quite a few things to look at, so I’ll attempt to run through them as quickly as possible:
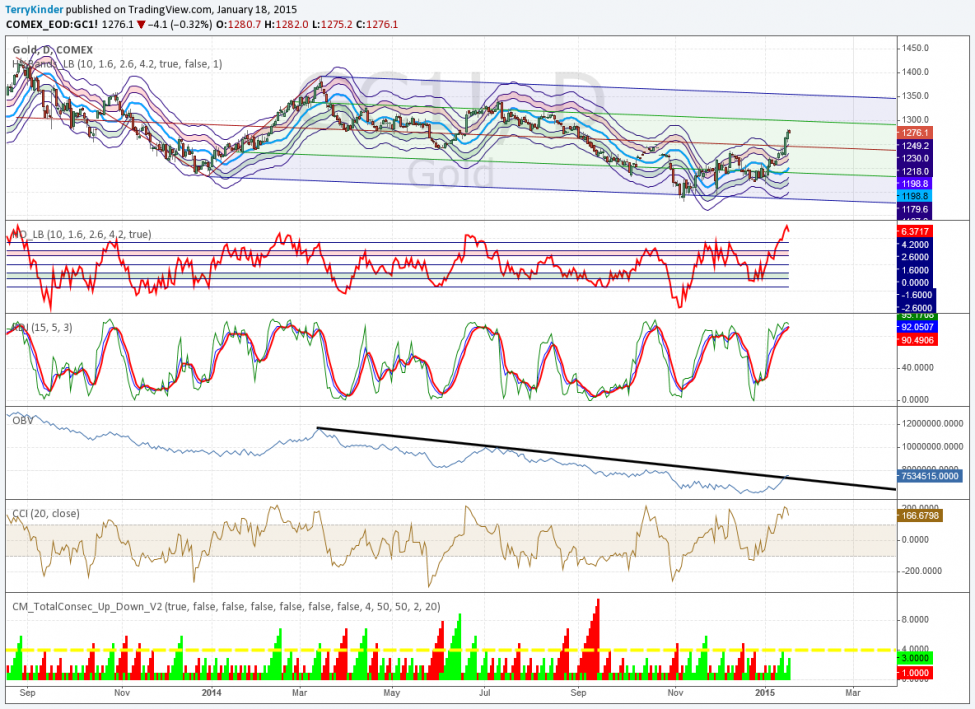
1) At the top of the chart is the gold price placed within the context of a Schiff Pitchfork and Hurst Bands. We’ll focus on the Hurst Bands. The gold price has jumped far above the extreme overbought level. It’s possible the gold price uptrend could continue, creating an even more extreme overbought condition, but this tends not to last more than a few days to ten or twelve days, generally;
Gold Price Uptrend: Is the gold price uptrend weakening or just taking a breather? Image: pixabay
2) Below the price chart is the Hurst Oscillator. It is the same as the Hurst Bands above, but in linear form. The little hitch down at the far right of the oscillator could be the beginning of a move back down away from overbought, along with a lower gold price, or it could be just a little hiccup. We probably won’t know for another few days;

3) KDJ – The important thing to know about KDJ in this instance is should J (the green line) dip below the other two lines it’s an indication that the gold price trend is reversing lower. You can’t really tell how long any trend up or down will be, but it is a good indicator when used in conjunction with your other favorite ones;
4) OBV (On Balance Volume) – You often see this used with stocks. However, I have found it useful in analyzing Bitcoin, gold and other prices. You’ll notice a downtrend that lasted from March of 2014 until this month. That downtrend was just broken. If it can be sustained it could indicate a trend reversal with the gold price moving higher. Should OBV break back down below the black line drawn on the indicator, that would likely be negative and indicate the gold price would move generally lower;
5) CCI (Commodity Channel Index) – This is an infinite indicator. However, reading above 100 are bullish. A reading over 200, at least with the gold price, may indicate that the gold price uptrend is overstretched and the price may drop. The highest reading I found going back to 2011 was over 323 back in 2012;
6) Bull-Bear Control Indicator – This indicator shows if bulls or bears are in control of the price action. Not surprising, given the gold price uptrend, it shows the bulls are still in control. You’ll notice the yellow dashed line at the 4 level. Bullish or bearish control reading above that level often mark points where the price begins to trend up or down. While there is a lot of green indicating the bulls in control, I would feel more confident in the continued gold uptrend if the green could extend far above the dashed yellow line. To me it shows that perhaps the conviction of the market in the gold price uptrend isn’t as strong as it could be.
The gold price uptrend thus far has certainly been impressive. It’s possible some of this owes to fear of instability within the Eurozone, which has allowed both a relatively stronger dollar and a gold price uptrend at the same time. This trend is certainly something that could continue to play out over time. The flip side is that prices rarely move straight up and the technical indicators for gold are at least near the point of flashing a warning that gold is near or at overbought levels.
At this point it isn’t clear if the gold price will hesitate here or push higher. If you’re purchasing gold as a hedge against economic instability and bad government policies, it may not really matter much to you what the indicators say. If you’re looking more to play the markets either through ETFs, mining stocks, etc., you may want to exercise caution here as things could get tricky here for the next few days.
Bullion.Directory or anyone involved with Bullion.Directory will not accept any liability for loss or damage as a result of reliance on the information including data, quotes, charts and buy/sell signals contained within this website. Please be fully informed regarding the risks and costs associated with trading in precious metals. Bullion.Directory advises you to always consult with a qualified and registered specialist advisor before investing in precious metals.


Leave a Reply