Gold Price Support Resistance Next Week (11-24-14)
 Bullion.Directory precious metals analysis 24 November, 2014
By Terry Kinder
Investor, Technical Analyst
It was another great week for gold last week as it finished above $1,202.00, which was an important level mentioned by Peter L. Brandt. Brandt indicated that if gold finished above $1,202.00 that it could indicate that the three plus year-old bear market was over. Personally, I’m not sure exactly what we are looking at here with gold. This could just be a counter-trend move – a bounce – before gold eventually turns lower. Gold price support resistance next week now has some new levels to overcome. So, let’s take a look at a recent chart of the price of gold and then continue on to the important gold price support resistance next week levels.

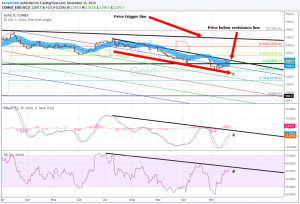
Gold Price Support Resistance Next Week (11-24-14): Gold will have to break through overhead price resistance, break above and stay above $1,202.00 and then find a way to take and hold $1,235.30.
As you can see in the chart of gold price support resistance next week, gold needs to find a way to take and stay above the important $1,202.00 level. In addition, it has a price resistance line almost directly overhead that it will need to break above in order to prove that gold’s upward momentum has legs. A significant level for gold next week will be $1,235.30 or the 0.382 Fibonacci retracement level.
Important chart features:
A. MACD continues to look stronger. However, it has yet to break through the zero line and hold above it for any amount of time recently. MACD needs to move above the black line drawn above it and continue moving up above the zero line if the gold price is going to advance significantly higher than it is now;
B. RSI has also shown strength. It would also be nice to see it break above the black line and continue to move higher;
C. The gold price trend is still down. Until the gold price can break through overhead price resistance.
Gold Price Support Resistance Next Week – Support, Resistance and Pivot Points

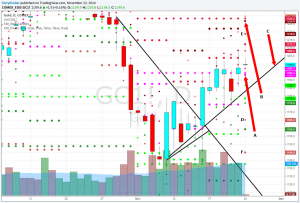
Gold Price Support Resistance Next Week (11-24-14): Another way to look at the gold price support resistance next week levels is through support, resistance and pivots.
Another way to look at gold price support resistance next week levels is through support, resistance and pivots. In the above chart the notable features are:
(Note: The above chart changes every day. This article is being written Sunday night, so it should be different on Monday. For a full explanation of the pivots indicator above visit here. To use it yourself you could sign up for a free account over at TradingView. Do not rely on the above to make any investment decisions as it changes daily and will be different by the time you see the above chart. A link to my live chart is here. Be sure to read the explanation in the pivots indicator link above.)
A. Pretty strong looking support around the $1,194.00 level. There is weekly (round pink circle) and monthly (pink cross) support;
B. Between $1,226.00 and $1,230.00 there is monthly (brown circle), monthly (red cross) and daily pivot (beige circle);
C. Daily support line;
D. Daily pivot (small brown circle);
E. Disregard;
F. Weekly pivot.
Gold Price Support Resistance Next Week – Other Important Levels
Support:
- $1,177.69 – $1,186.70
- $1,160.60 – $1,164.27
Resistance:
- $1,202.00
- $1,207.31 – $1,212.86
- $1,235.30
- $1,242.31 – $1,247.33
Critical gold price support resistance next week is $1,202.00. If price can break above $1,202.00, then $1,235.30 will be the next important level to the upside. Should price fail to reach and/or hold $1,202.00 then look for a re-test of the important $1,186.70 level. Below $1,186.70 the $1,160.60 – $1,164.27 level should provide support
![]() This license allows for redistribution of this article, commercial and non-commercial, as long as it is passed along unchanged and in whole, with credit to Bullion.Directory, linking to the original article.
This license allows for redistribution of this article, commercial and non-commercial, as long as it is passed along unchanged and in whole, with credit to Bullion.Directory, linking to the original article.
Bullion.Directory or anyone involved with Bullion.Directory will not accept any liability for loss or damage as a result of reliance on the information including data, quotes, charts and buy/sell signals contained within this website. Please be fully informed regarding the risks and costs associated with trading in precious metals. Bullion.Directory advises you to always consult with a qualified and registered specialist advisor before investing in precious metals.


 Material provided on the Bullion.Directory website is strictly for informational purposes only. The content is developed from sources believed to be providing accurate information. No information on this website is intended as investment, tax or legal advice and must not be relied upon as such. Please consult legal or tax professionals for specific information regarding your individual situation. Precious metals carry risk and investors requiring advice should always consult a properly qualified advisor. Bullion.Directory, it's staff or affiliates do not accept any liability for loss, damages, or loss of profit resulting from readers investment decisions.

Leave a Reply