

We put some puzzle pieces together in our gold price analysis
 Bullion.Directory precious metals analysis 11 November, 2014
By Terry Kinder
Investor, Technical Analyst
Gold Price Analysis: A failed price breakout
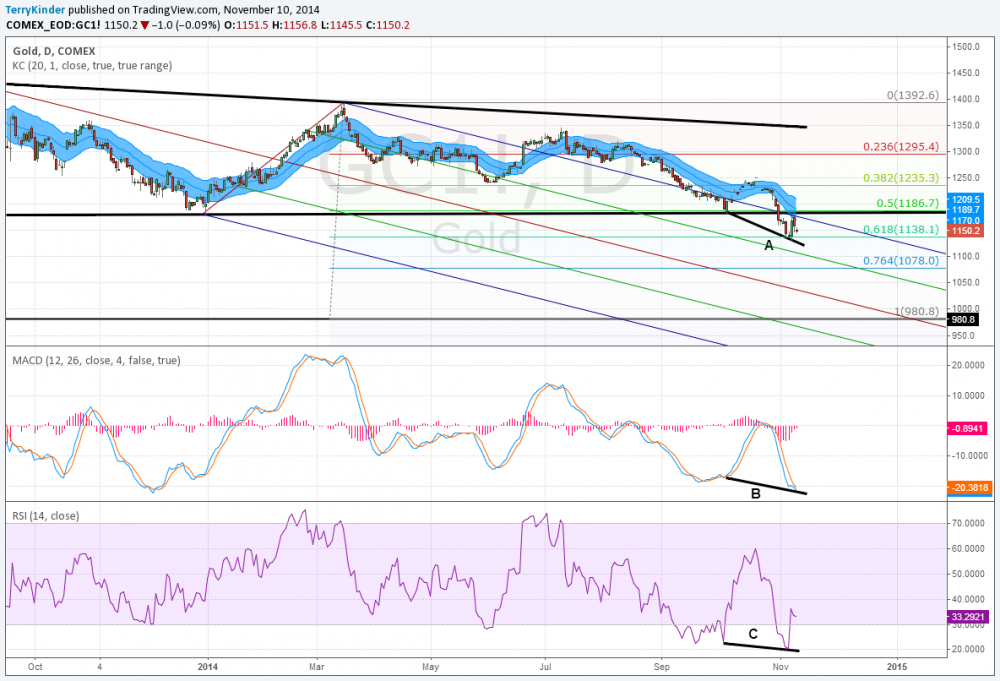
Looking at the chart above, you can see that the gold price failed to break out of the descending Andrews’ Pitchfork. It was also unable to break through the price trigger line visible near the $1,350.00 level. A few other interesting features of the above chart are:

1. Gold price bounced off support level near 0.618 Fibonacci Retracement level or $1,138.10.
2. Price ran up to upper parallel channel of pitchfork but failed to break through it.
3. Overhead price resistance near the 0.5 Fibanacci Retracement level or $1,186.70.
4. Noticeable divergence between gold price and MACD and RSI. Some of this divergence is now in the past, and it isn’t overly dramatic, but it is still worth noting.
Another important piece of our gold price analysis puzzle is a look at the price of gold miners. We won’t go into this in-depth, but the chart below of Tanzanian Royalty Exploration Corp. gives an idea of the economic pain that many of the miners are experiencing.
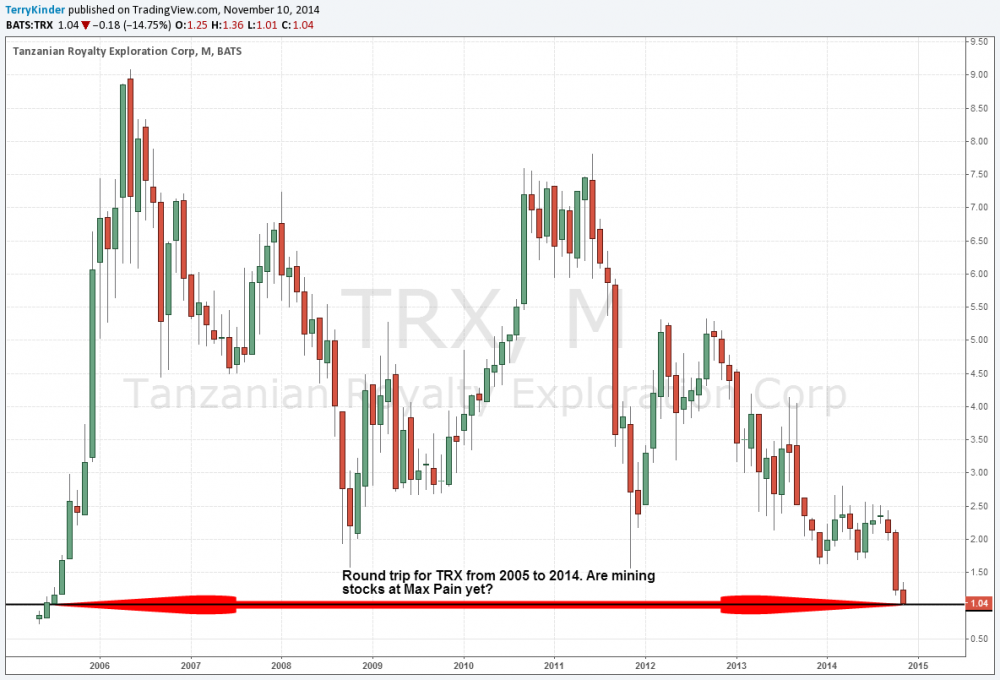
Gold Price Analysis: The TRX stock price is at values last seen in 2005
The TRX stock price is at a level not seen since 2005. Many other mining companies are at or near levels not seen since 2008.
McEwen Mining (MUX) is another example of a mining stock that has seen a steep price drop. It doesn’t look quite as bad as TRX, but it’s pretty bad. The black horizontal line drawn on the bottom of the chart touches price level last seen in 2008 and 2005.
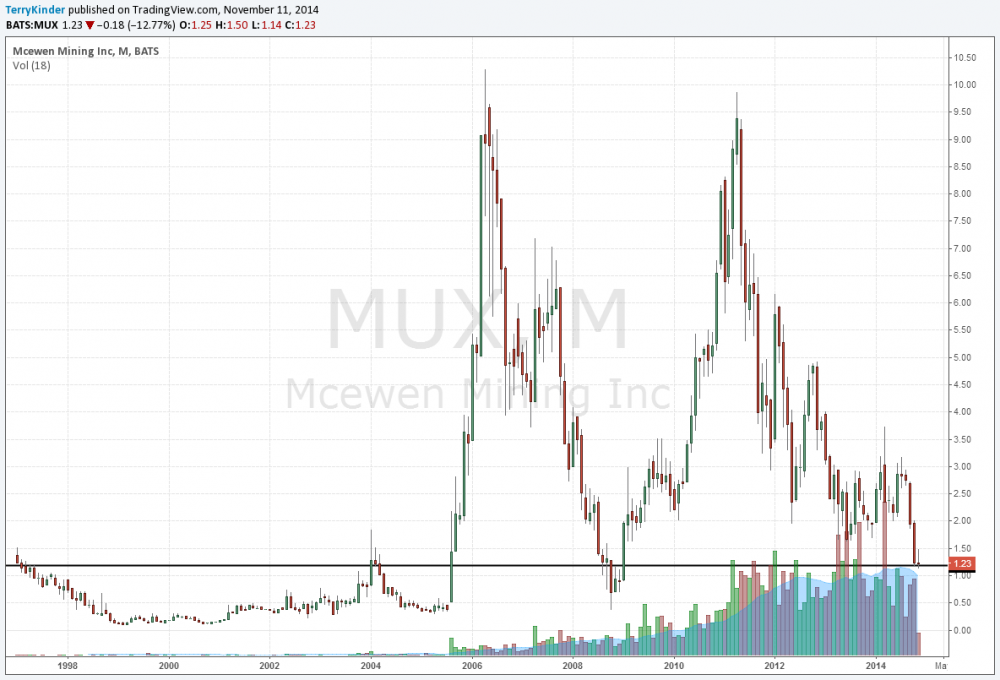
Gold Price Analysis: McEwen Mining (MUX) is price at levels last seen in 2008, 2005 and the 1990’s
The Sprott Gold Miners ETF (SGDM) has plunged almost 40% in value from $25.95 to $15.58 since July of this year.
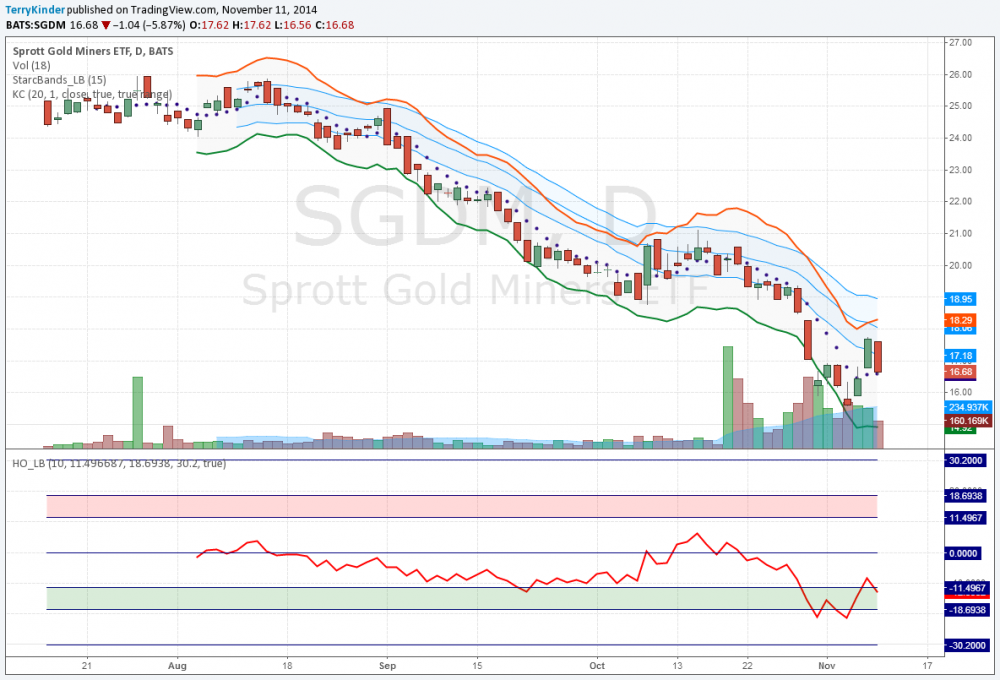
Gold Price Analysis: Sprott Gold Miners ETF is down nearly 40% since just July
Then there is my favorite gold mining ETF – JNUG (Direxion Daily Jr Gld Mnrs Bull 3X ETF). I have felt like Captain Ahab hunting Moby-Dick trying to figure JNUG out. In life, of course, there are no guarantees, and JNUG has slapped me around quite a bit just to insure I learned that lesson well. Having said that JNUG is nearing a bottom, not just because it’s only three dollars and change from being worth zero, but because the chart below strongly indicates it.
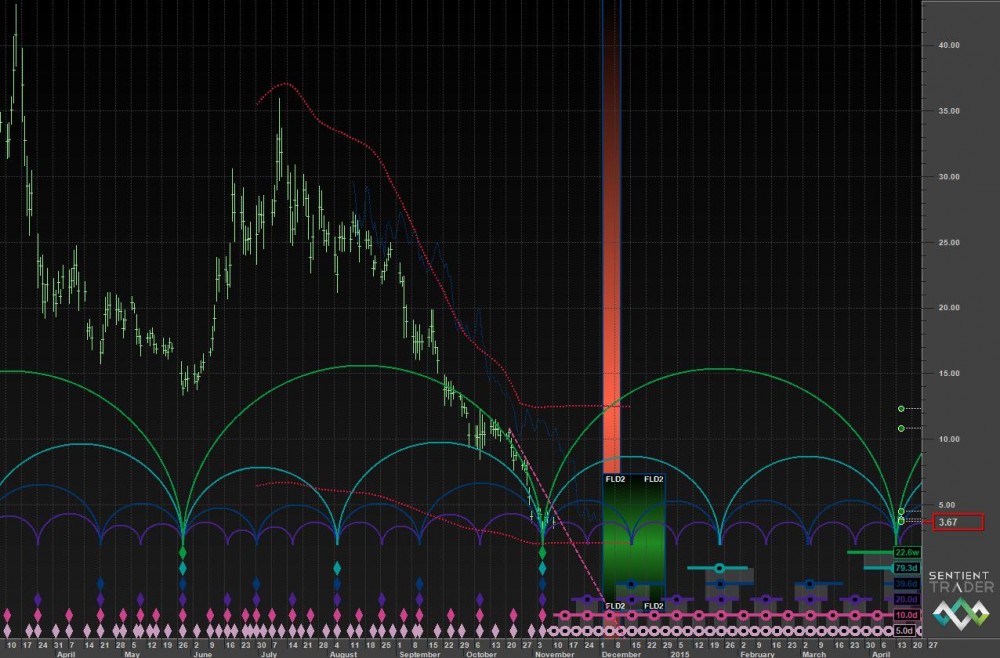
Gold Price Analysis: JNUG junior gold miners ETF looks to be near the bottom, if nothing else because it is three dollars and change from being worth zero
It’s a little confusing to look at, but if you look at the above chart right around November 3rd, JNUG’s cycles bottomed and were confirmed by the Sentient Trader Program which specializes in Hurst Cycle Analysis. Those semi-circles on the chart indicate cycles of varying lengths and the cycles tend to bottom in sync with each other. If the chart is correct the bottom is either in or ought to be in because the cycles are turning up and price should follow the cycles higher.
Changing gears, three technical analysts whose work I follow all agree that the gold price is going lower and their price projections are all very similar.
1. Peter L. Brandt projects a gold price of around $970.00.
2. Jordan Roy-Byrne believes gold could fall to strong support around $1,000.00.
3. Gary Wagner, in the video below, notes the strong U.S. Dollar and that gold could move down to $977.60 – $990.90 as a worst case scenario in the interim term.
Those levels above are very similar to the $980.79 level I mentioned in my recent post Gold Price Going to the Mat.
Gold Price Analysis Conclusion:
A lot of very smart technical analysts believe that the gold price is going to drop to $1,000.00 or below and I certainly wouldn’t want to argue with them. With the dollar near $88.00, and gold now showing much inclination to break out of the descending Andrews’ Pitchfork, it doesn’t seem promising that gold could climb higher. One thing in favor of the gold price is that it has managed not to fall even more quickly despite all of the dollar pressure. However, unless the gold price exits the pitchfork and runs past the 0.50 Fibonacci Retracement level around $1,186.70, then there is a pretty good chance that gravity pulls the gold price back towards the median line of the pitchfork near $980.00. Certainly at that point, upon making contact with the median line, I would expect the price to rebound higher.
A factor that could play out in favor of a rebound in the gold piece would be if the stock prices of gold miners begin to recover. As you could see with stocks like TRX and MUX, as well as ETFs like SGDM and JNUG, it has been a very difficult past few months for mining stock prices. JNUG and SGDM have seen all time lows and TRX and MUX are at levels not seen since 2008, 2005 or even back to 1990’s in the case of MUX. So, a rebound in the gold mining stocks, along with the HUI being able to hold above 150 could provide an indication that perhaps the pain is beginning to ease for the miners and might signal a stronger gold price.
Having said all of the above, I’m not necessarily expecting that, even should miners recover and the gold price begin to move higher, that we would be looking for a re-test of the 2011 highs anytime soon. I wold be more inclined to think that should the $1,186.70 level be breached on the pitchfork chart that we could then see a test of $1,235.30 and $1,295.40. Any higher price, at this point, is simply a little too high to speculate on given the current price level.
Unless the gold price manages to move up in dramatic fashion soon, it seems probable that price will continue to follow the downward sloping pitchfork lower, setting up a test of the $1,078.00 and $980.00 levels.
Bullion.Directory or anyone involved with Bullion.Directory will not accept any liability for loss or damage as a result of reliance on the information including data, quotes, charts and buy/sell signals contained within this website. Please be fully informed regarding the risks and costs associated with trading in precious metals. Bullion.Directory advises you to always consult with a qualified and registered specialist advisor before investing in precious metals.


Leave a Reply