

An update on what the “gold fan” is saying about the future price of the yellow metal
 Bullion.Directory precious metals analysis 22 January, 2015
By Terry Kinder
Investor, Technical Analyst
The “gold fan” we discussed a few days ago isn’t me (although I’m holding). The gold fan is not human. Instead, it is a technical analysis tool called a Pitchfan – a combination pitchfork and Gann Fan. We’ll review the charts and analysis to see where we stand, plus add some additional charts just for fun
We’ll start out with our original and not updated original Pitchfan chart because it has all of our original lines, levels, etc.
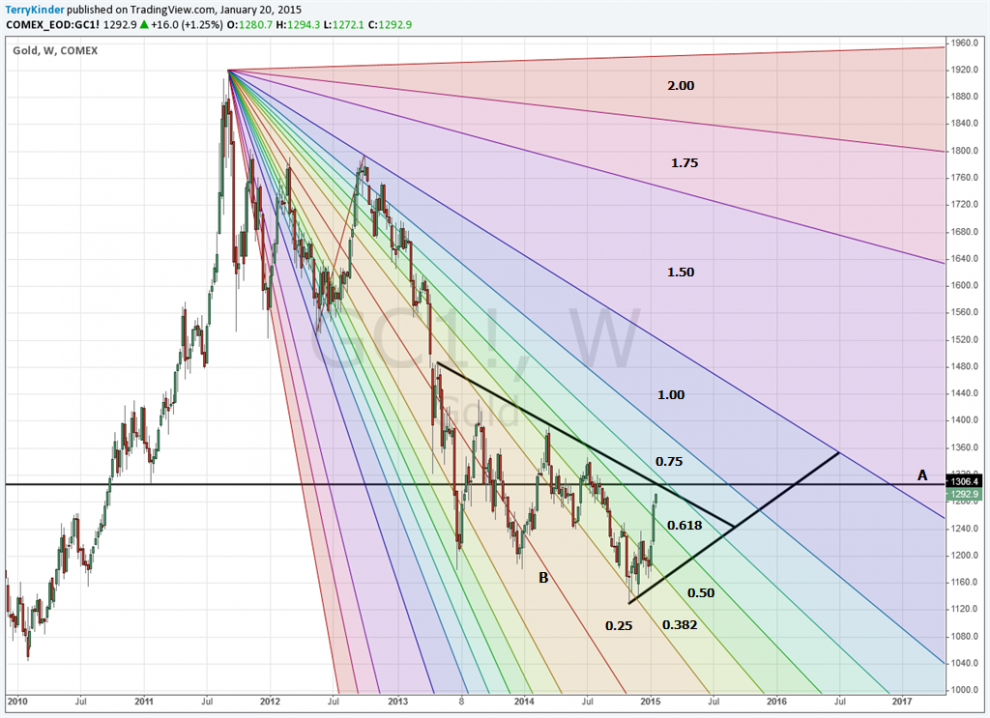
Our original gold Pitchfan with original markings, levels, etc.
At the time gold was just under $1,293.00 on the chart. Notice there is horizontal line drawn labeled A at $1,306.40. It was not meant to be an exact line but was a rough estimate of where the gold price would need to cross, if it did so fairly soon, to exit the top portion of the triangle. So, what happened?

The gold price tested the line drawn at $1,306.40, going to $1,307.00 before dropping lower.
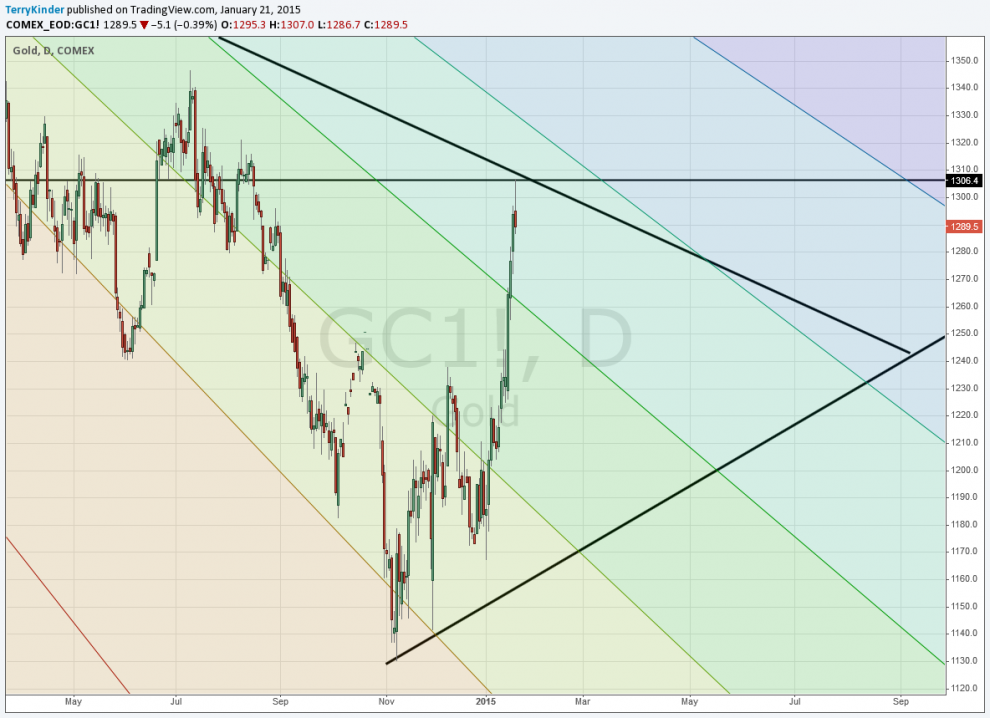
So, pulling in closer and changing our view from a weekly to daily chart, we can see that the gold price moved up to the horizontal line at $1,306.40 and up to $1,307.00 before moving lower.
The bigger thing to be aware of is the triangle within which gold has been trading for a while now. To go higher, the gold price will need to break above the upper boundary of the triangle and then hold above, at a minimum, the triangle apex in order to have a good chance to move higher.
For a little more perspective, let’s switch back to a weekly Pitchfan chart.
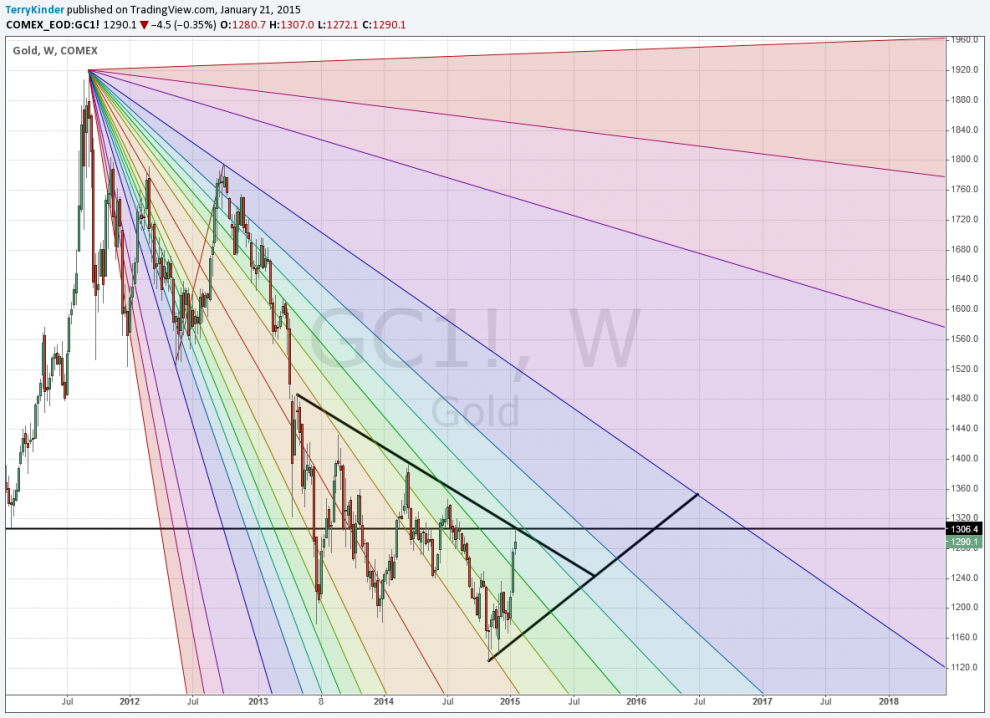
Gold is still trading within a triangle patter and needs to break above it in order to move higher.
I haven’t bothered to mark up the above chart, but if go back to the top of this page and look at the original chart, you’ll see that gold is currently at the 0.618 level. You’ll also noticed it has been several years since the yellow metal reached that level. Just above that level, and a bit outside of the triangle is the 0.750 level. It has also been a few years since the gold price was at that level.
Beyond the 0.750 level are the 1.000 levels and 1.500 levels. Gold hasn’t reached the 1.500 on this chart, so it gives some idea of the challenge that level, and, to a lesser extent, the 1.000 level will present.
To get a better sense of the price resistance that gold faces, let’s take a look at a daily gold price chart with the monthly price pivots.
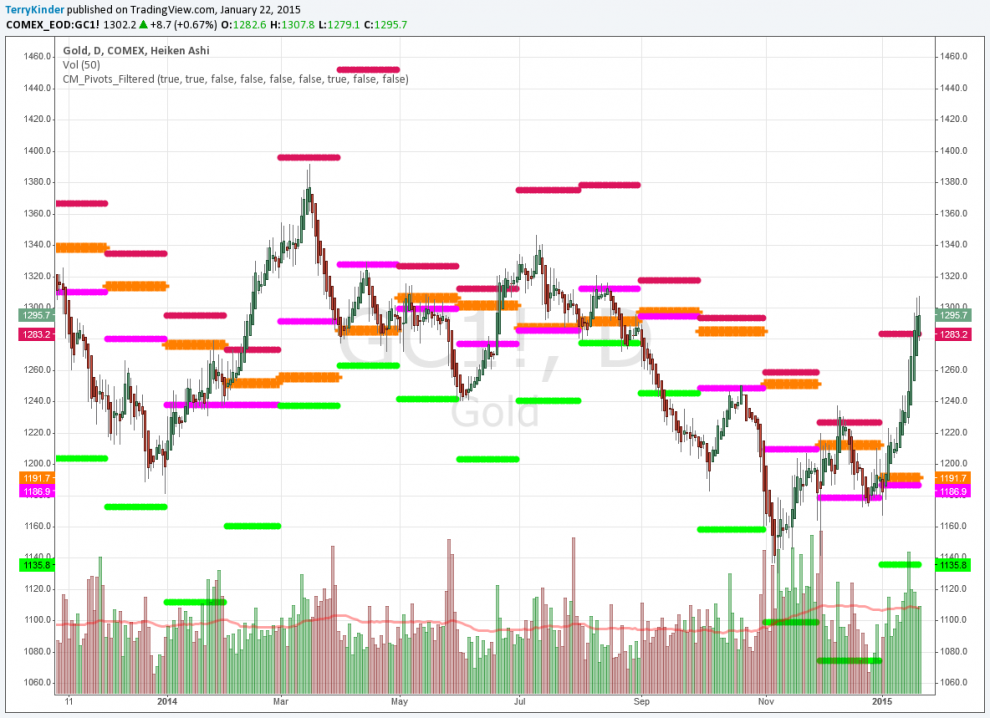
This daily gold chart shows the monthly pivot points for gold indicating price is becoming overextended.
The gold price has managed to stretch above the upper monthly pivot at $1,283.20 during the last three days. This could be viewed at least a couple of different ways – 1) Price has broken above the pivot and will continue higher; 2) Gold has been unable to move significantly above the pivot point and will fall back towards it and then below it. Although it isn’t pictured, in 2011 the gold price blew past the upper pivot point on its way to $1,920.00, which was $200.00 above that pivot. However, before it had made its full move the upper pivot shifted higher. Currently the upper pivot of this chart has not shifted. Until it does it is safer to assume that the gold price won’t stretch much more. In the end, we just can’t know, so let’s look at one final chart.
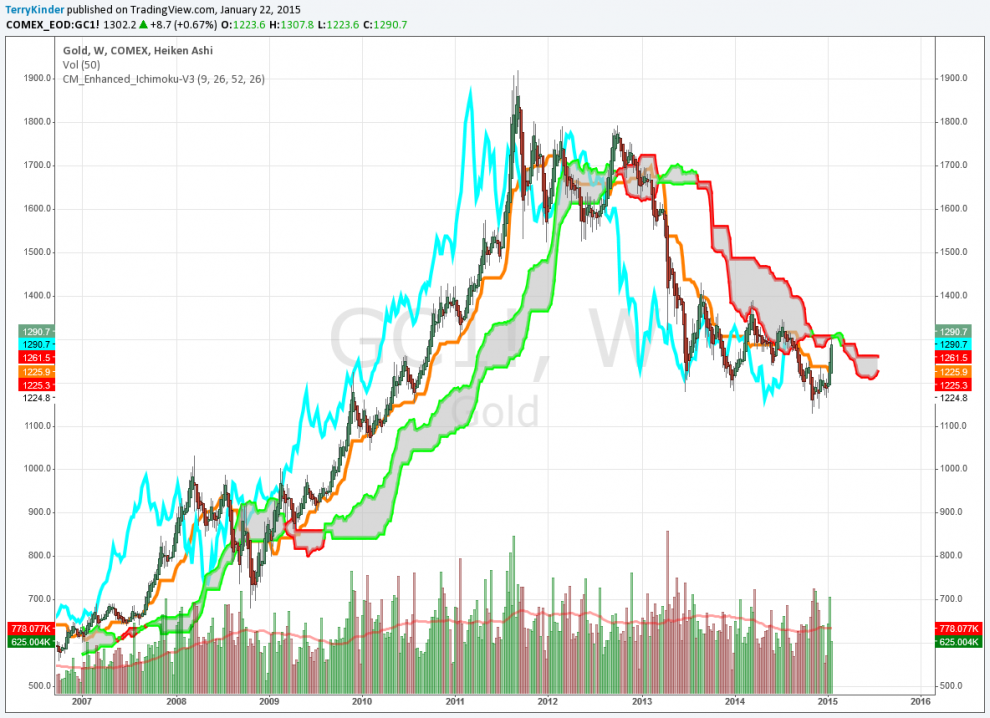
Gold still can’t see the sun for the clouds.
Similarly to the pivot chart, the Ichimoku Cloud chart shows that the gold price is pretty much bumping it’s head up against a ceiling. In this case, a ceiling of clouds. If gold can manage to climb a little bit higher it could see sunlight at last. However, the Ichimoku cloud is signaling that the gold price is likely to move lower as shown by the shaded cloud area surrounded by red lines.
Not to belabor the point too much, but notice too on the above gold cloud chart that there is a lot of red downtrend on the right side of the chart versus the green uptrend on the left side. We have seen a few green blobs recently, but we need to see a lot more to reverse the overall downtrend that gold has been in.

Has the gold price stalled despite all of the cheers for the ECB’s QE program?
Essentially, despite all the breathless chatter about European QE, the situation for gold is more or less the same as it has been. I always find it amusing when someone points that something – for example European QE as related to the gold price – was “priced in” already. It’s a bit like saying fire is hot (or perhaps the heat has been priced into the fire). As FA Hayek pointed out, prices take into account the knowledge of millions of individuals. By definition the known is “priced in” to the price. If it wasn’t, then prices wouldn’t be prices, they would just be random, meaningless numbers.
An additional note
Martin Armstrong notes that gold needs a close above $1,305.00 just to keep price action neutral. There is additional price resistance at $1,310 and above, which fits pretty nicely with our Pitchfan charts and the triangle pattern. If the gold price can’t break higher out of the triangle now, with the ECB QE program just announced, then one has to wonder if the price might reverse and move toward the lower portion of said triangle. Armstrong also points out:
A daily closing back below 1284 will warn of a retest of support. A closing on Friday below 1287 will also warn of at least a temporary high. A closing back below 1255 will signal a correction is now likely.
Gold will need to do something soon to move to the upside or it risks falling back below $1,250.00 towards $1,235.30.
Bullion.Directory or anyone involved with Bullion.Directory will not accept any liability for loss or damage as a result of reliance on the information including data, quotes, charts and buy/sell signals contained within this website. Please be fully informed regarding the risks and costs associated with trading in precious metals. Bullion.Directory advises you to always consult with a qualified and registered specialist advisor before investing in precious metals.


