Taking a detailed look at the gold charts
 Bullion.Directory precious metals analysis 26 January, 2015
By Terry Kinder
Investor, Technical Analyst
With the gold price near some critical levels and the Greek election results upon us, it’s a good time to review some gold charts.
Pitchforks
Daily
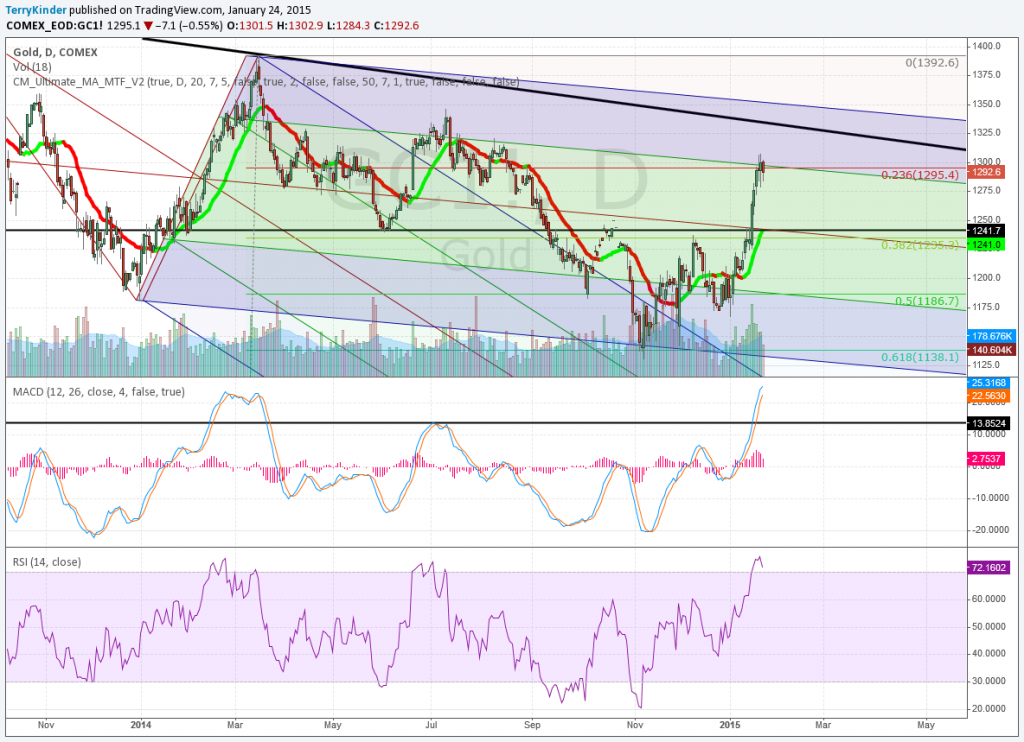
On the daily chart, featuring both a Schiff Pitchfork (darkly shaded) and a standard Andrews’ Pitchfork, we can see the gold price has seemingly stalled near the $1,295.40 or 0.236 Fibonacci Retracment level.
Technically MACD is pretty well extended, although nothing says it can’t become more so. RSI remains overbought and has declined slightly recently.
Weekly
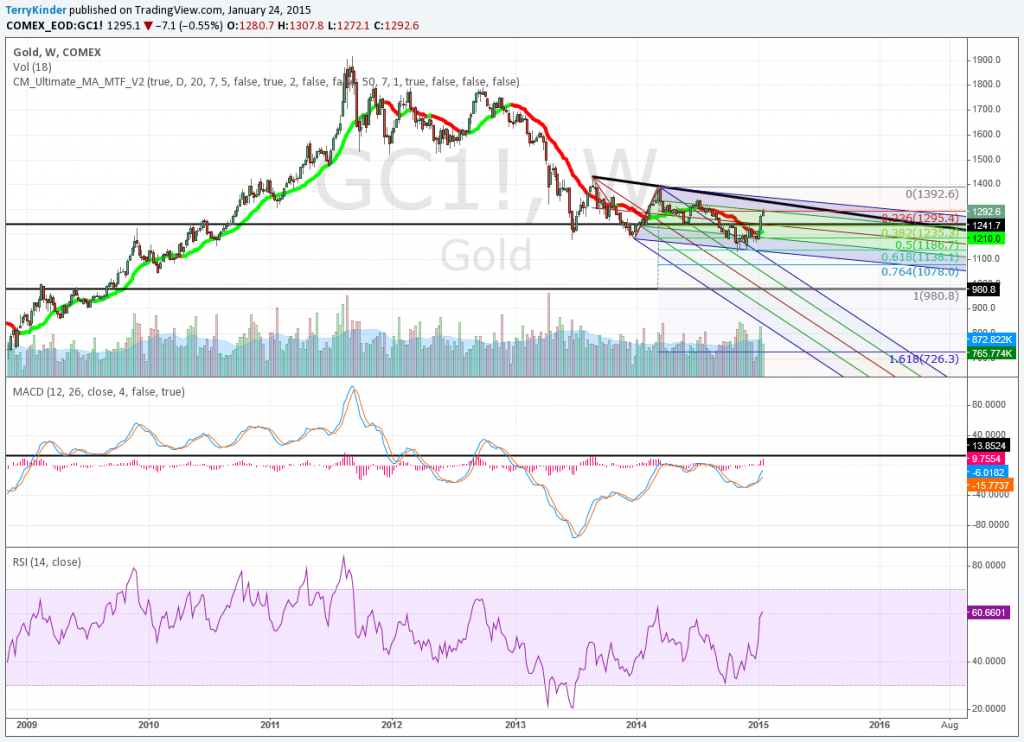
On the weekly chart RSI is above 60 and MACD remains below the zero line, so there is clearly room for the price to run higher.
Monthly
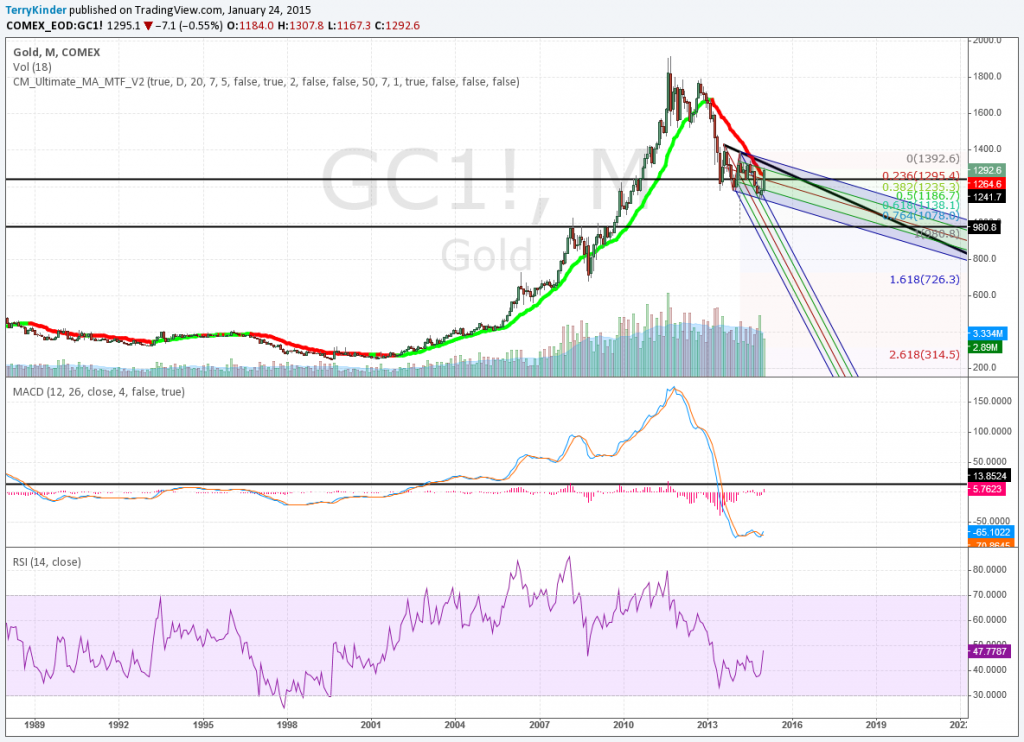
The monthly gold chart is even more dramatic than the weekly chart as it shows the magnitude of the gold price decline not only in terms of price but also technically in terms of MACD and RSI which have remained very subdued since 2013.
Pitchfans
Daily
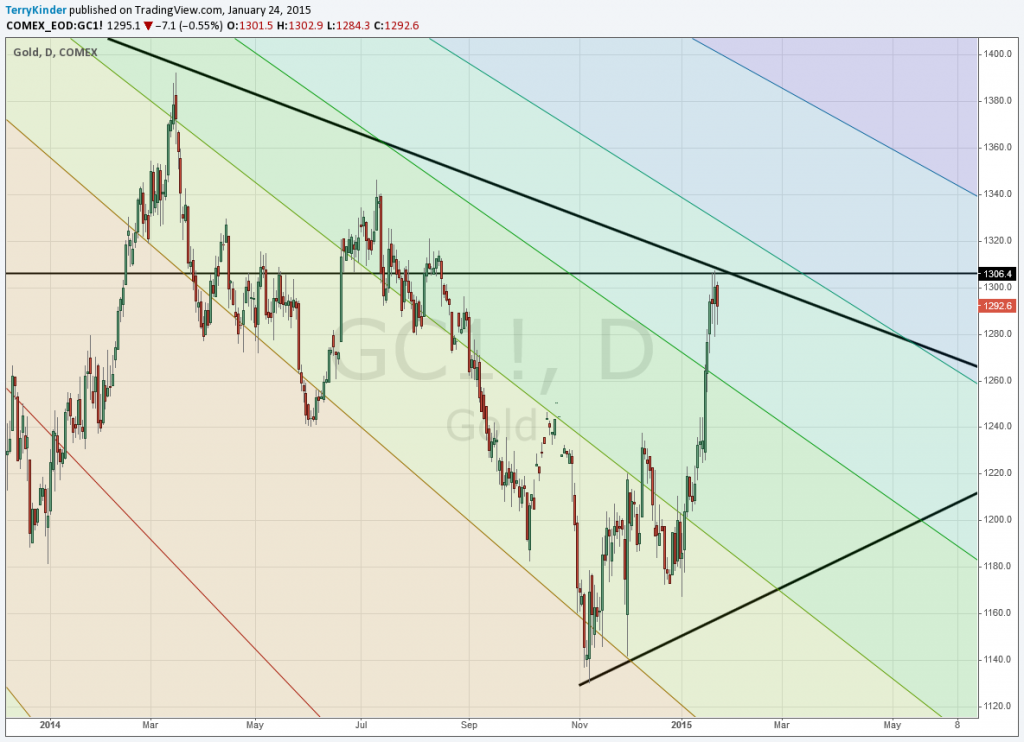
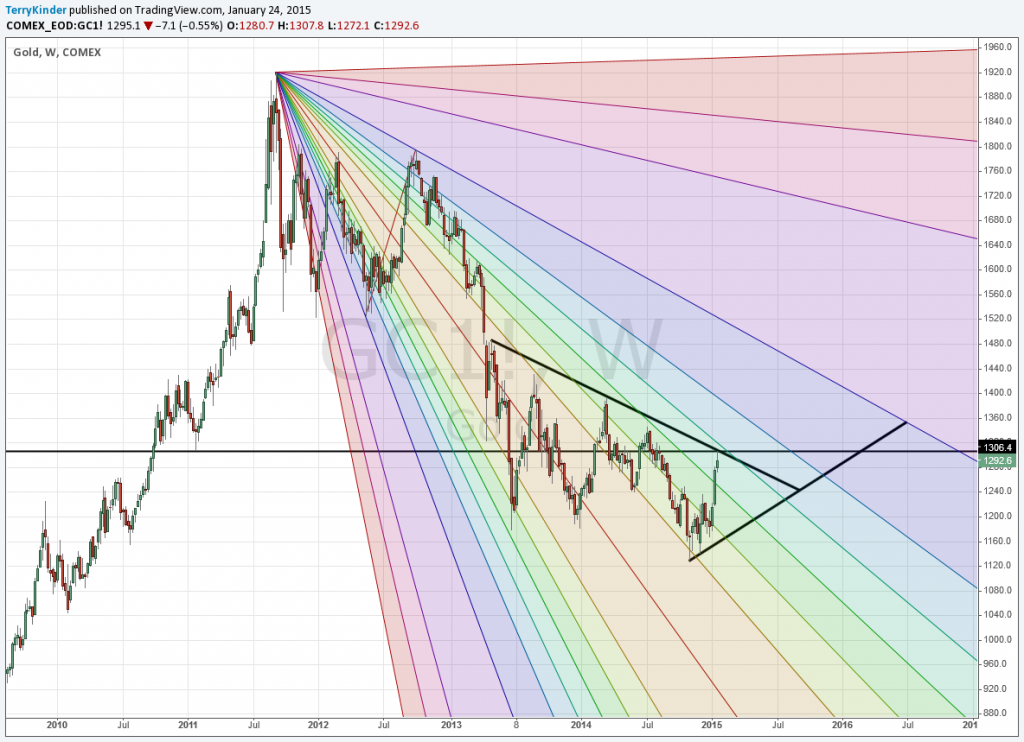
The gold price has been tantalizingly close to breaking out of the triangle as can be seen on the daily Pitchfan chart.
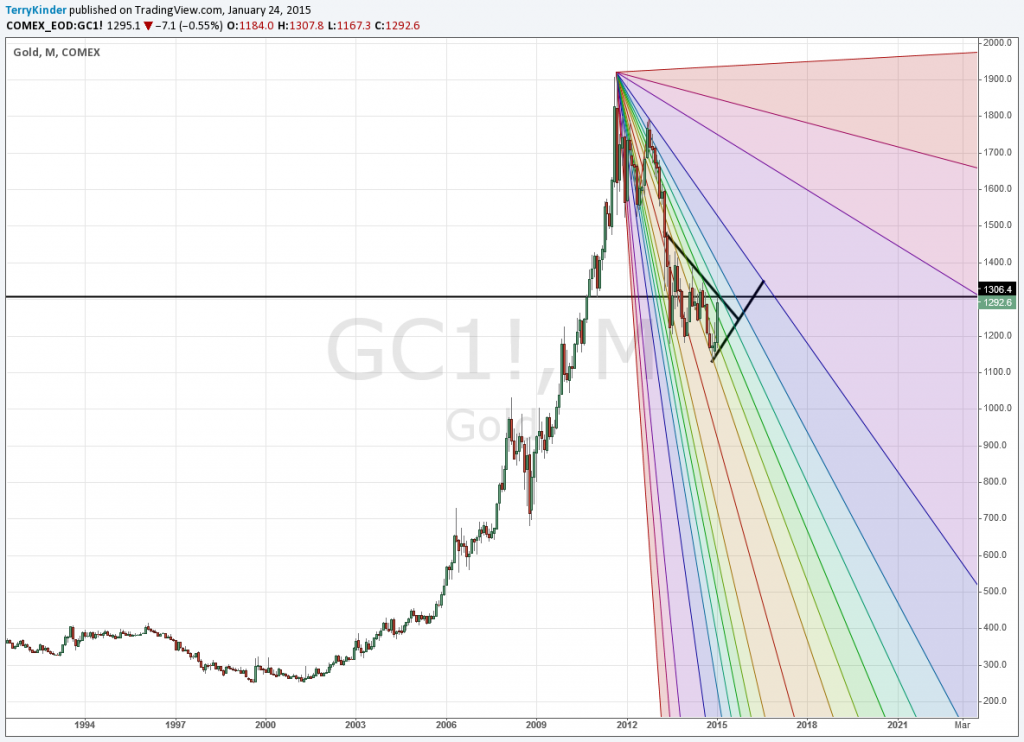
The gold daily Pitchfan – a combination pitchfork and Gann Fan – shows how the gold price has been unable to break above the upper boundary of the triangle pattern. Gold briefly moved above the critical $1,306.40 level before reversing lower.
Weekly
The weekly chart give a little more perspective. The gold price is near the top border of the triangle but has not yet been able to punch through it. It is in territory, in terms of Pitchfan levels, that it hasn’t been in since 2013. If it doesn’t move through the top of the triangle soon then it would not be unexpected for price to lose some altitude.
Monthly
On the monthly chart the price decline from the top looks pretty dramatic. You’ll notice that the bottom of the triangle has been extended out to act as a support line. Gold probably needs to hold support at that ine to continue moving higher. Also, even if gold does push above the upper border of the triangle, it needs to maintain above the triangle apex or the price could move back into a decline.
Pivots
Weekly Chart – Monthly Pivots
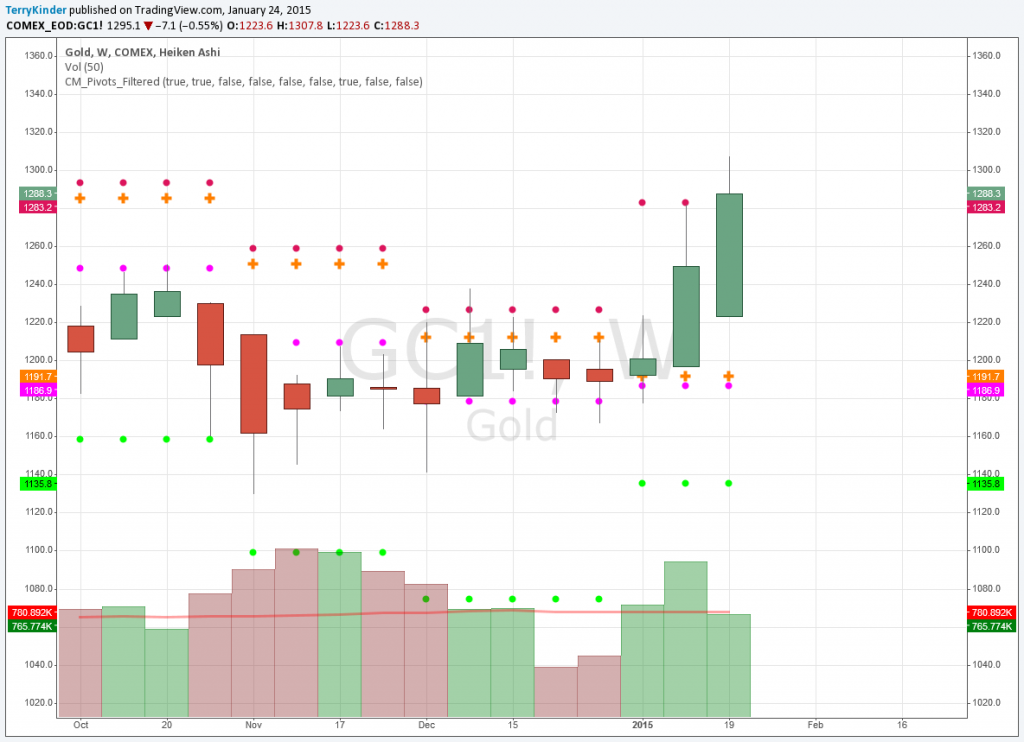
On this weekly chart of gold with monthly pivots gold is about $5.00 above the highest weekly pivot.
Gold on this weekly chart with monthly pivots has moved above the highest monthly pivot by around $5.00. We will have to see next week if the program plots a higher monthly pivot or not. If not it’s difficult to say if the price will come back down toward the pivot or move above it. However, volume is slightly below the moving average, so until stronger volume comes in it may be difficult for the gold price to move higher.
Weekly Chart – Yearly Pivots
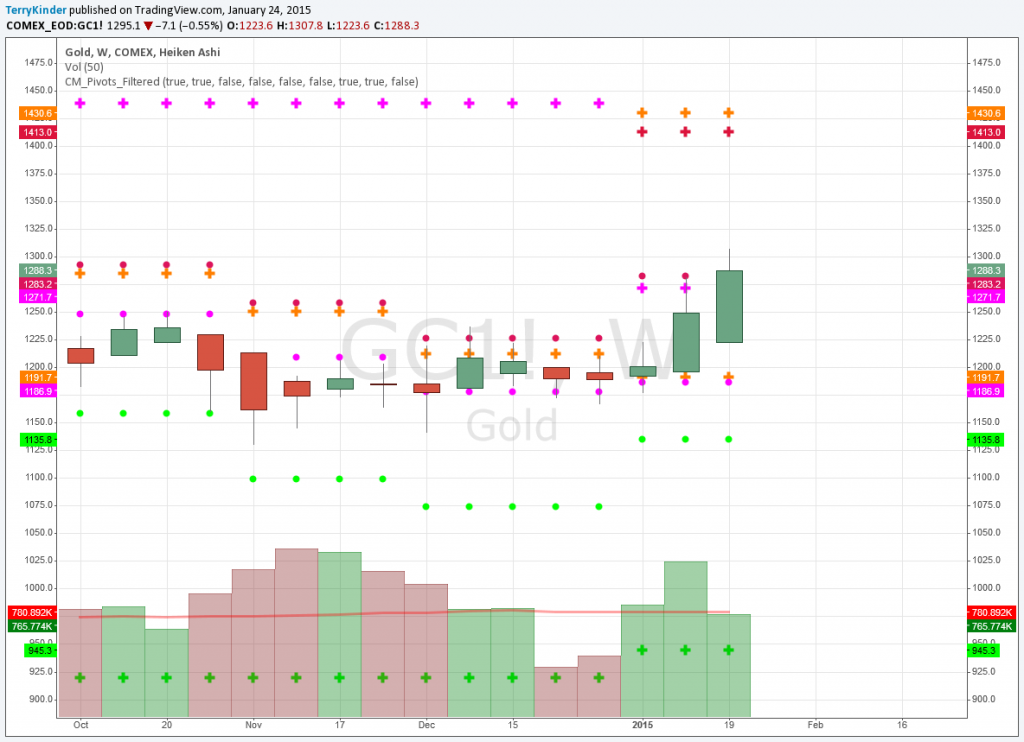
On the weekly gold pivot chart the price is a little above the $1,271.70 – $1,283.20 resistance level with volume weakening.
The gold price has pushed slightly above both a yearly ($1,271.20) and monthly ($1,283.20) price pivot (yearly = + and monthly = colored circle). If price can hold above that level, the next yearly targets are both above $1,400.00.
Monthly Chart – Yearly Pivots
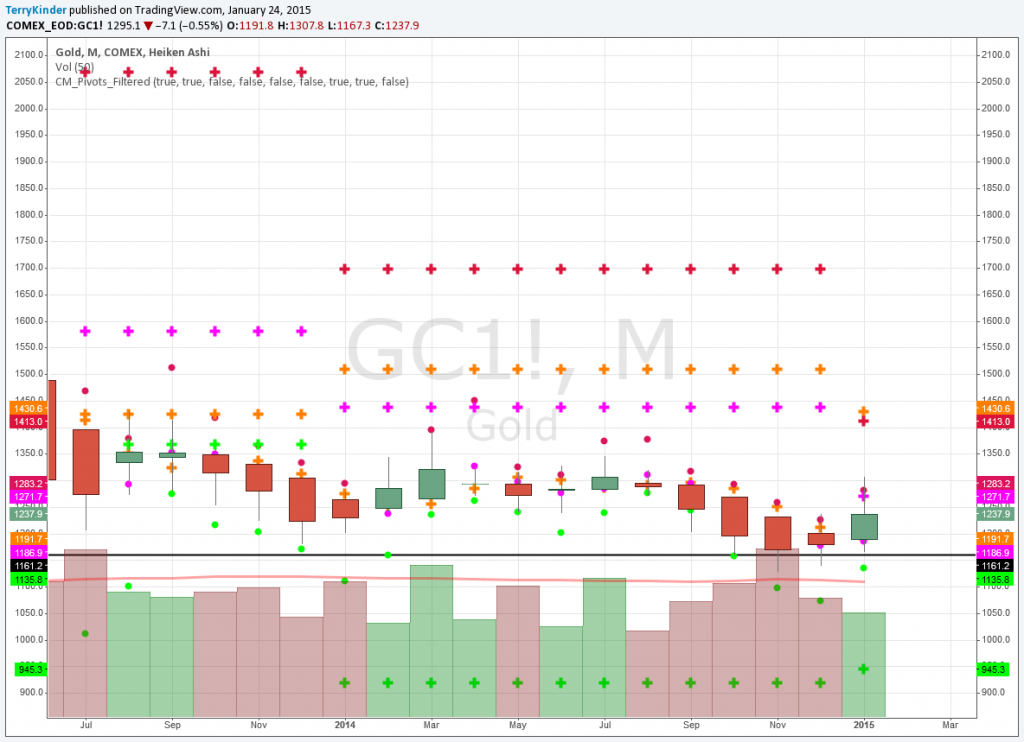
On the monthly pivot chart you can see the support for gold at $1,186.90 – $1,191.70 and then resistance at $1,271.70 – $1,283.20. Above that there is resistance at the $1,413.00 – $1,430.60 level. Volume on the monthly has been declining, and it will likely be difficult to see a sustained climb higher in the gold price without stronger volume.
Yearly Chart – Yearly Pivots
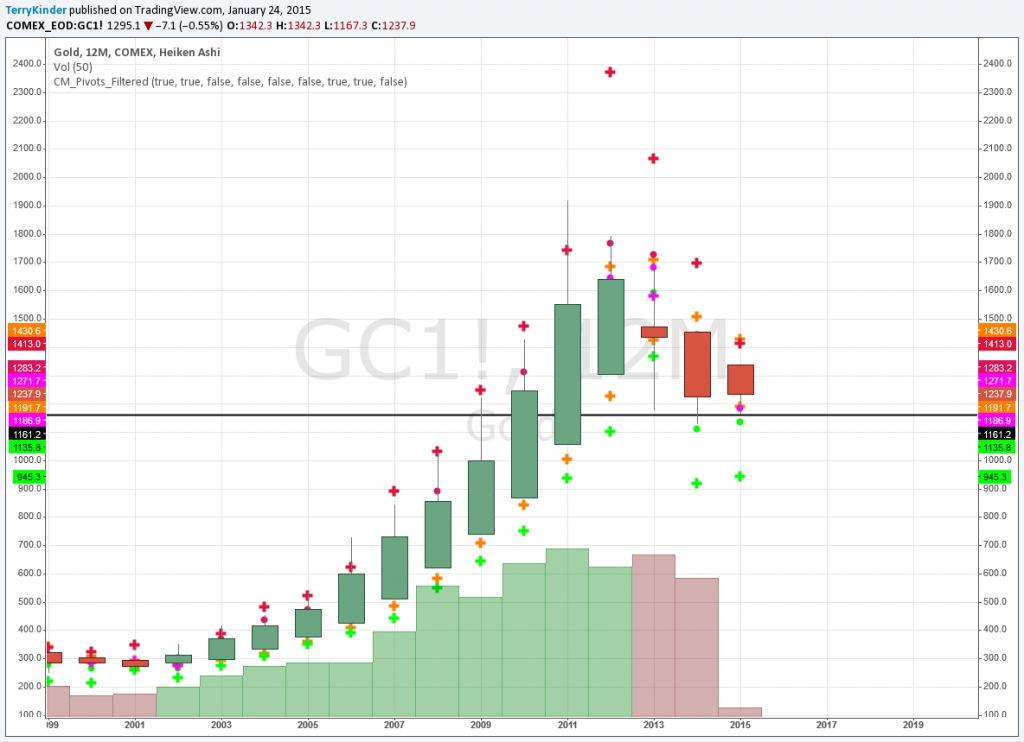
On the yearly pivot chart gold has support between $1,186.90 – $1,191.70 and resistance near $1,271.70 – $1,283.20 and again at $1,413.00 – $1,430.60.
The yearly pivot chart for gold shows pretty much the same picture as the monthly chart. The lowest yearly pivot point is at $945.30 and above that is $1,135.80. However, for the moment, it appears there is fairly solid support at the $1,186.90 – $1,191.70 level.
Some thoughts on the charts

Charts boil down the knowledge of millions of individuals into an easier to interpret form. Image: pixabay
Until, and unless, gold breaks out of the triangle formation highlighted on the Pitchfan charts, the gold price isn’t likely to gain much altitude. The $ 1,306.40 level has been difficult for gold to overcome. The $1,295.40 or 0.236 Fibonacci Retracement level has also proved a challenge for gold.
Looking at the wrong things
I couldn’t find the exact quote, but heard the following idea attributed to William J. O’Neil, founder of Investor’s Business Daily, and one of the best investors to have ever lived. Basically O’Neil said that you should look at the what, not the why. What that means, to me, is that much analysis spends countless hours trying to figure out why things happened or why they should occur in the future. Instead of focusing on the whys, we should look at the what – price.
As individuals, we can only understand but a fraction of what is going on in any market at any given time. I can read everything about the gold market 8 hours a day 5 days a week and never come close to scratching the surface.
Recently, when discussing the ECB QE narrative I highlighted some things F A Hayek had said about pricing – amongst them:
There is simply too much knowledge, too widely dispersed for a single individual to hope to grasp it all. Yes, sometimes an analyst will look at any given situation and happen upon the correct answer. The difficulty is in being able to do this with consistency.
It’s extremely difficult to analyze any market without allowing some bias to slip in. It is that bias that creates incorrect analysis based on personal opinions, preconceptions and emotions. The point of analysis isn’t to be in favor or against an asset. For instance, my holding gold or silver should not interfere with my analysis of where the future price might be headed. If it does, then I’m not doing my job as a technical analyst, nor am I serving you the reader.
There are plenty of places a reader can go to seek opinions, read interesting theories, and encounter inflated opinions – either to the upside or downside – of where the price of gold is headed. My intention is to offer the best analysis within my human limitations of the important factors influencing the price of gold.
Why technical analysis
Going back to what F A Hayek said:
Technical analysis looks at abstract signals (prices) which are based on the dispersed knowledge of millions of individual people. It is simply impossible to concentrate that same knowledge using what is termed fundamental analysis. This should be obvious by the incorrect analysis of money supply and hyperinflation that was so predominant in much of the gold market analysis a few years ago. We could point to other errors in improperly analyzing the future price of precious metals as well. I myself was as guilty as anyone of making those kinds of errors several years ago and have tried to learn from my own mistakes.
Nobody is perfect and anyone who tries to present himself or herself as not making errors, or who ridicules other for their mistakes, ought to be considered suspect. Analysis is not a contest. Rather, analysis is the search for the truth – a truth that can be of benefit to all. Correct analysis can keep us from making mistakes, as well as aid us in making correct decisions.
Conclusion
The gold price is nearing a critical juncture. It appears gold may have a little more room to run up than down. The question is whether or not the gold price has the buying support that it needs to move higher. It’s something interesting to speculate about, but we won’t know whether or not additional buying volume steps forward until it does.
Given all of the things that would, in theory, appear to be supportive of gold, e.g., ECB QE, the Greek elections, continued conflict in the Ukraine, economic instability within the Eurozone and the world, one would think that would offer some support to the gold price. The bottom line is, however, as one individual in this world it would be presumptuous of me to assume that I can possibly understand, in its entirety, what moves the gold price.
That is something no human being on this earth is capable of. Instead, what I attempt to do, sometimes with success and other times no, is to analyze price – which is the cumulative knowledge of millions of individuals and provides an abstract signal which helps guide the decisions of all – in terms of repeating patterns and within the context of price and volume in order to get a better idea of the direction and momentum of future price.
As one small soul, with one mind, the most I can hope to do is tap into the cumulative knowledge provided by price to get a better idea which way gold will move.
Bullion.Directory or anyone involved with Bullion.Directory will not accept any liability for loss or damage as a result of reliance on the information including data, quotes, charts and buy/sell signals contained within this website. Please be fully informed regarding the risks and costs associated with trading in precious metals. Bullion.Directory advises you to always consult with a qualified and registered specialist advisor before investing in precious metals.




 Material provided on the Bullion.Directory website is strictly for informational purposes only. The content is developed from sources believed to be providing accurate information. No information on this website is intended as investment, tax or legal advice and must not be relied upon as such. Please consult legal or tax professionals for specific information regarding your individual situation. Precious metals carry risk and investors requiring advice should always consult a properly qualified advisor. Bullion.Directory, it's staff or affiliates do not accept any liability for loss, damages, or loss of profit resulting from readers investment decisions.
