

GDXJ: Are the junior gold mining stocks finally nearing a bottom?
 Bullion.Directory precious metals analysis 11 October, 2014
By Terry Kinder
Investor, Technical Analyst

GDXJ: Are the junior gold miners finally seeing the light at the end of the tunnel?
Image: pixabay.
We will look at several charts that appear to point toward higher prices for the GDXJ, as well as try to figure out what price the GDXJ might reach in the future.
The GDXJ fell from a high of $46.50 back in July to as low as $30.39 in early October. Recently it’s managed to recover somewhat, ending the week at $32.73.

GDXJ: A look at the charts
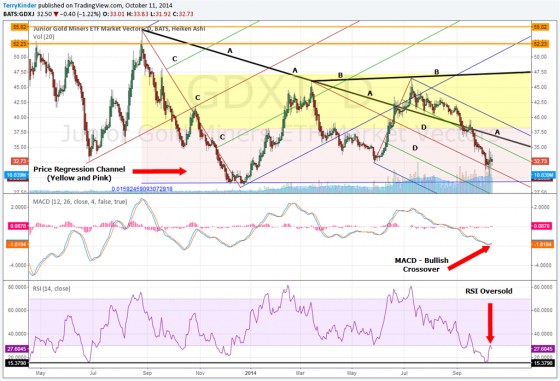
GDXJ is in the middle of several patterns. It has fallen out of the large Andrews’ Pitchfork labeled C. GDXJ price recently bounced off of the median line of the smaller pitchfork labeled D. Another way to look at the GDXJ price is through the yellow and pink colored price regression channel where price has dipped as low as $28.82 and been as high as over $48.00.
- A – Price resistance line which dates back to August of 2013. The GDXJ price broke above price resistance in July, but by September it fell below the resistance line again;
- B – Price trigger line formed by small pitchfork labeled D. So far, price hasn’t come anywhere near testing the trigger line, but given past price action it wouldn’t be surprising to see price make a run at it;
- C – Large Andrews’ Pitchfork labeled C. When the GDXJ price fell out of the large pitchfork a new pitchfork labeled D was drawn;
- D – Small pitchfork labeled D. The GDXJ price currently rests very close to the red median line of this smaller pitchfork. It appears that the price will bounce off of the pitchfork median line. This would be a sign of price strength and could set up the possibility of testing price resistance line A. Should price move through resistance line A, then the next target for price would be to move through the upper parallel line of the pitchfork. Should price be able to move through the upper parallel line of the pitchfork, then the next target would be the price trigger line labeled B which rests very near the top of the price regression channel;
- Price regression channel colored yellow and pink. The GDXJ price has remained largely within this price channel since September 2013;
- MACD recently experienced a bullish crossover which could result in the price moving higher;
- Relative Strength Index (RSI) – RSI remains oversold. If you look below the RSI there is a black horizontal line drawn which shows there is pretty strong support around the 15 level going back to March 2013.
The next GDXJ chart is a little bit more cut and dry than our previous one.
The chart uses the 31, 61, and 91-day displaced moving averages which are a modified form of JM Hurst Cycle Trading as outlined in the book JM Hurst Trading Without the Rocket Math.
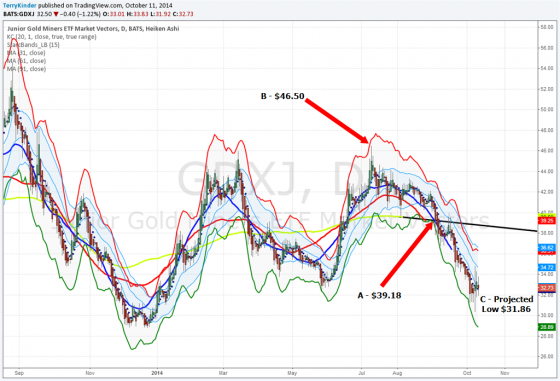
GDXJ: Using 31-61-91 day displaced moving averages, it looks like the GDXJ may have already hit its projected low (or interim low) of $31.86.
We used the following steps to determine that the pivot (or interim) low in the GDXJ would be $31.86:
- 1. Placed the 31, 61, and 91-day displaced moving averages on the chart. The averages were displaced by 16, 32 and 46-days respectively. This basically takes the moving averages and pushes them over to the left on the chart time scale;
- 2. Extended the 91-day moving average into the future in order to see where it would cross another of the moving averages. In this case we used the 91-day moving average because the 61-day moving average did not look like it would cross with the 31-day average any time soon;
- 3. We noted where the 31-day and 91-day moving averages crossed. In this case, the averages crossed at the $39.18 level;
- 4. We found the previous pivot high which was at the $46.50 level;
- 5. Next, we subtracted where the moving averages crossed from the price level of the pivot high. In this case we subtracted $39.18 from $46.50 to arrive at $7.32;
- 6. Finally, we subtracted the difference between the pivot high price and where the moving averages crossed from the value of where the moving averages crossed. In this case we subtracted $7.32 from $39.18 to arrive at $31.86.
Where will the GDXJ price go next?
Using the displaced moving averages, we determined the $31.86 was likely the pivot (or interim) low price for GDXJ. At this point, several price levels come into play. One of the next important price levels could be near $36.83-$36.90 which would be around the level where the GDXJ price might attempt to cross above price resistance line A, which dates back to August 2013. Some other prices, which may offer resistance in the future, are:
- $39.93;
- $41.15;
- $46.50
The $36.83-$36.90 price level is likely the most important price level to watch for now as it will likely mark the point where price breaks above price resistance line A. After that, keep an eye on $39.93 where the GDXJ price could rise above the upper parallel line of the small pitchfork. After that, $46.50 is probably the most important price level to watch for GDXJ as it is likely the level where price will meet the strongest resistance.
I would expect price not to break much above that level or to break above the top of the yellow and pink price regression channel. However, should price break above that channel and stay above it, then we might be looking at a far higher GDXJ price.
GDXJ, along with the junior gold miners have likely found a bottom for now. Key price resistance points to watch for the moment are $36.83-$36.90 and $39.93.
Bullion.Directory or anyone involved with Bullion.Directory will not accept any liability for loss or damage as a result of reliance on the information including data, quotes, charts and buy/sell signals contained within this website. Please be fully informed regarding the risks and costs associated with trading in precious metals. Bullion.Directory advises you to always consult with a qualified and registered specialist advisor before investing in precious metals.


Leave a Reply