

Euro gold price versus dollar gold price: Looking at the gold price chart in both euros and US Dollars can aid in making chart patterns a little clearer.
 Bullion.Directory precious metals analysis 18 September, 2014
By Terry Kinder
Investor, Technical Analyst
People often ask at what dollar price is gold likely to find support or resistance. But it can be argued that the dollar price of gold is not very relevant for a lot of the old-school technical tools. The static price levels of prior highs and lows do not generally show much significance as support or resistance agents once they are reached again.
The big reason for this is that gold is traded around the world, and in every currency. So what might look like an important support or resistance level on a dollar-based chart could look totally different in another currency.

Before looking at the euro gold price, we’ll take a look at it in dollars
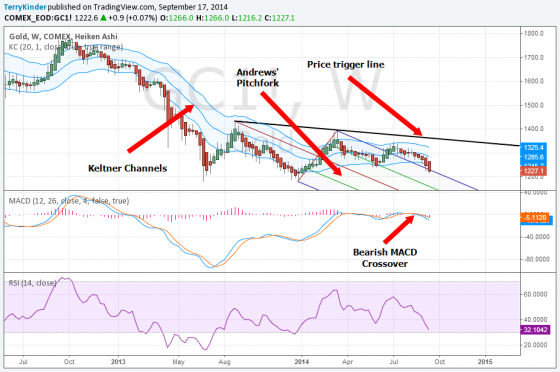
The above chart of weekly gold (Comex continuous) in dollars, as we’ll see in a moment, presents a different picture than the euro gold price. Here are a few of the significant features of the chart:
Overall, the gold in dollars chart paints a pretty bearish picture. About the only thing it has going for it, which isn’t much, is that the Relative Strength Index (RSI) hasn’t fallen into oversold territory yet.
McClellan, in his article, explains why differences between the charts of the euro gold price and dollar gold price are important:
The chart above shows gold priced in both dollar terms and in euros. They are obviously similar, which is what we would expect. But when there are differences, then those differences can be instructive. I have found that when the two plots disagree, it is usually the euro price plot that ends up being right about where both are headed.
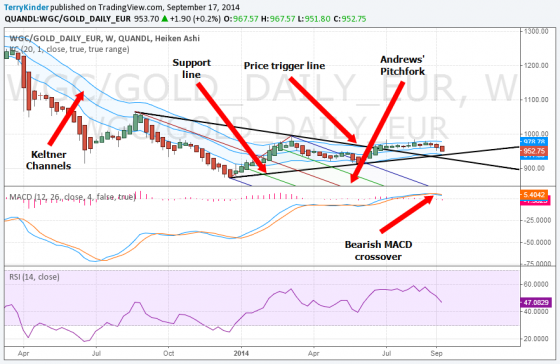
The euro gold price stands in contrast to the dollar gold price. The euro price of gold has crossed the price trigger drawn from the Andrews’ Pitchfork. The euro gold price also remains within the Keltner Channels versus the dollar gold price which has fallen beneath the channels.
A few of the significant features of the euro gold price chart are:
If McClellan is correct about divergence between euro gold price versus the dollar gold price, then the recent move of the euro gold price above the price trigger line could be significant. Another important divergence is the fact that the euro gold price exited the Andrews’ Pitchfork and has continued to move away from it. In contrast, the dollar gold price exited the pitchfork, then showed weakness as the price fell back towards the pitchfork. A final divergence worth keeping an eye on is RSI. The euro gold price RSI has been much more “middle of the road” lately while the dollar gold price RSI is edging closer to oversold territory.
When looking at price charts, make it a practice to look at them priced in different currencies. You may just see some important patterns you had not noticed before.
Bullion.Directory or anyone involved with Bullion.Directory will not accept any liability for loss or damage as a result of reliance on the information including data, quotes, charts and buy/sell signals contained within this website. Please be fully informed regarding the risks and costs associated with trading in precious metals. Bullion.Directory advises you to always consult with a qualified and registered specialist advisor before investing in precious metals.


Leave a Reply