

Time to be short the junior gold miners?
 Bullion.Directory precious metals analysis 2 March, 2015
By Terry Kinder
Investor, Technical Analyst
After getting hammered to a record low JDST is showing signs of life as junior gold miners have given back some of their gains.
Background: The Gold Price:
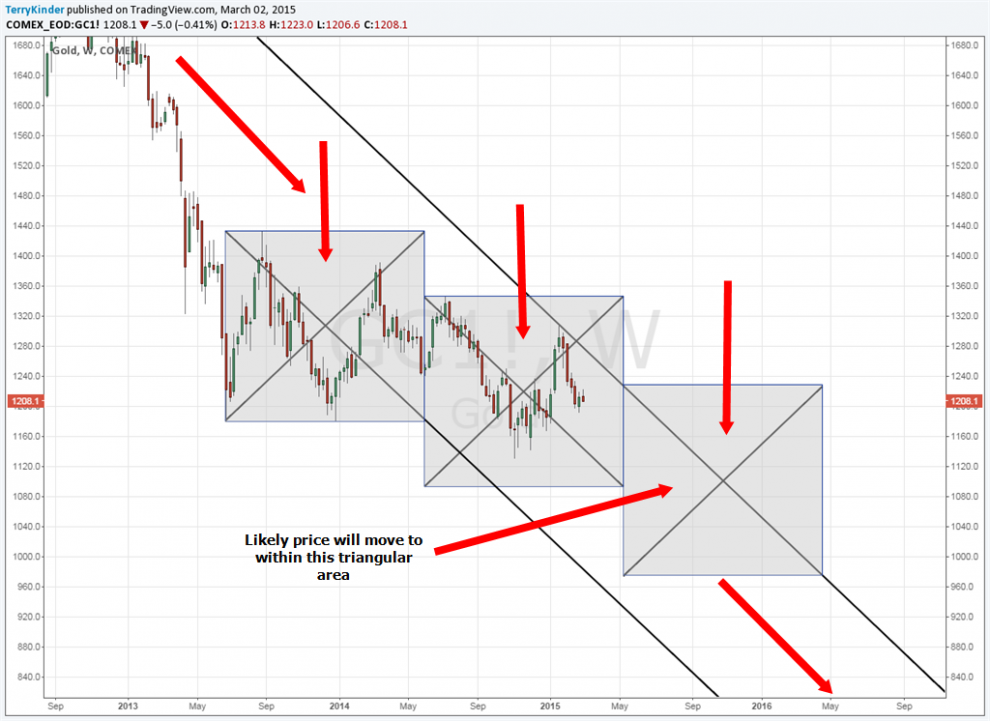
The gold price has been stair-stepping lower
The gold price has slowly been stair-stepping lower, snaking down a descending channel. In our chart we drew our first square based on the pivot high and low prices. We then made a copy of that square and moved it to line up with the next pivot high price.

The third square has been placed in an estimated position based on drawing a 45 degree line down from the previous pivot high price.
Each square has been divided into four parts by drawing two 45 degree diagonal lines in each square. Price tends to fall from highs and rise from lows back towards these lines, demonstrating the lines represent price support and resistance.
Two diagonal lines are placed on the chart to help mark the descending price channel. Additionally, three downward facing arrows point to the upper portions of each square. Notice that in the first and second squares price has only entered this upper portion (an upside down looking triangle) for short periods of time. This could be indicative of weak price action with the price hesitating, then reversing.
At this point, it appears likely that price will enter the third square in the area signaled on the chart. It’s possible that within this next square price might test the upper portion of the price channel, perhaps succeeding in finally breaking above it. Nothing is certain, but it does look as if there is potential for that to happen.
JDST
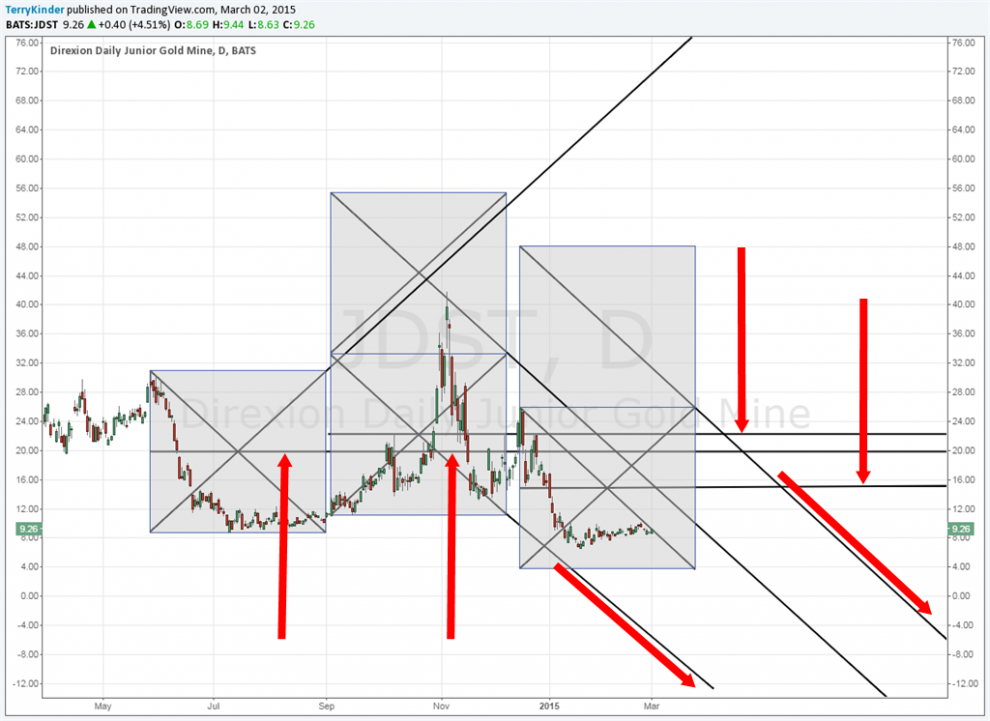
JDST, a 3X bear junior gold mining ETF, has slowly been rising off its lows
While it may not look like much on the chart, JDST has moved from a low of $6.51 to over $9.00, which is a substantial move. On the daily chart, JDST is very close to crossing over into the triangle-shaped right-hand portion of the square.
This would set up several potentially interesting possibilities:
1) Price could move up to the next diagonal line above it (not marked on the chart), which would take the price near $12.00;
2) Should the price continue to move higher after that, then the price could move up to near $16.00. This is based on a horizontal line through the last square at the point that the two 45 degree lines meet;
3) Above that the next targets would be approximately $20.00 and $22.00.
There are, of course, risks to buying and hanging onto JDST for anything but a short period of time:
1) The gold price could become choppy, but JDST might move lower;
2) The gold price could move higher and JDST lower;
3) While JDST is designed to track the junior gold miners, but with 3x short leverage, it doesn’t always do so. There are times when the gold price is falling and so is the price of JDST;
4) With these kinds of ETFs, it’s always a good idea to take a close look at the prospectus and act accordingly.
Whether or not shorting the junior gold miners is a good idea or not will, of course, depend on the price of gold. As always, it is best to consult a licensed professional investment adviser and conduct your own due diligence before making any investments.
Bullion.Directory or anyone involved with Bullion.Directory will not accept any liability for loss or damage as a result of reliance on the information including data, quotes, charts and buy/sell signals contained within this website. Please be fully informed regarding the risks and costs associated with trading in precious metals. Bullion.Directory advises you to always consult with a qualified and registered specialist advisor before investing in precious metals.


