

A look at what the dollar technical indicators say about the high flying buck.
 Bullion.Directory precious metals analysis 6 January, 2015
By Terry Kinder
Investor, Technical Analyst
The U.S. dollar has climbed from $78.90 in May of 2014 to over $91.00 this month. While many dollar technical indicators show the dollar is overbought does that mean the dollar will reverse lower soon? Not necessarily. Let’s take a look at a few indicators to see why.
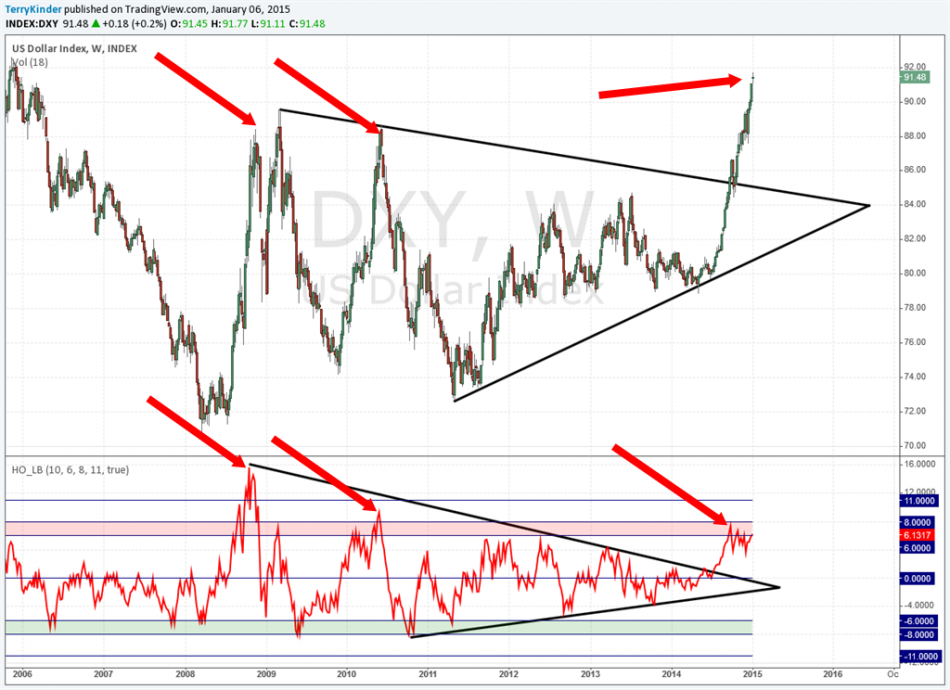
Dollar Technical Indicators: While the dollar is looking overbought, you can see looking at the first two arrows at the bottom of the chart that it has been more overbought in the past than it is presently.
Given the very steep climb in the U.S. Dollar Index (DXY) since May, you’d expect that it would be overbought. In fact, it has been. Yet, according to the weekly Hurst Oscillator, the dollar isn’t as overbought now as it was toward the end of 2014. In fact, this first of our dollar technical indicators, isn’t nearly as overbought now as it was in 2010 or 2008. So, while the dollar has climbed substantially, that doesn’t mean it can’t climb even more before reversing lower.
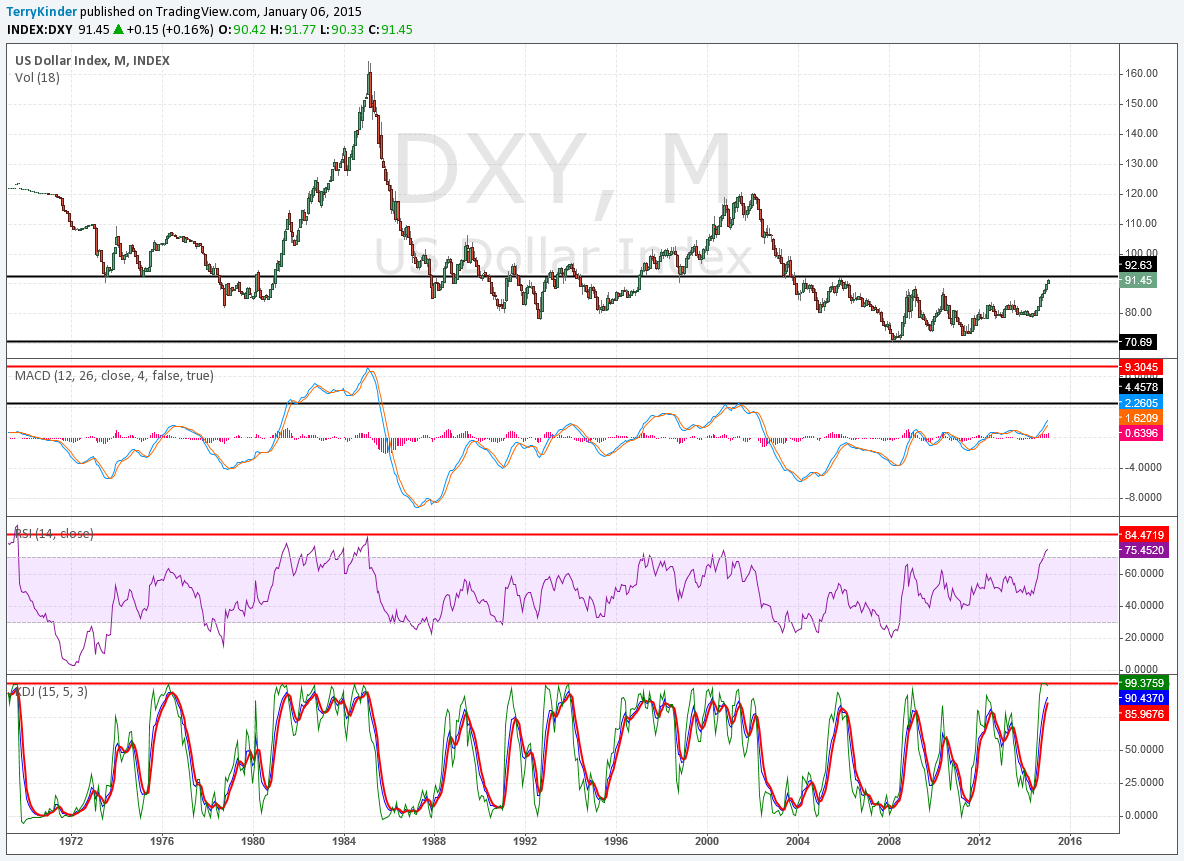

Looking at the monthly chart with additional dollar technical indicators above, there is evidence that while the dollar is looking stretched, it still has room to run. RSI is approacing levels last seen in 2000.

Dollar Technical Indicators: While dollar technical indicators show the buck is overbought by some measures, that doesn’t mean the dollar’s run higher is over. Image: pixabay
One final intersting note about the monthly dollar chart – price is nearing the top of a more than decade long channel. The top part of the channel is right around $92.63. That’s a little over $1.30 away from the $91.32 DXY level as this is being written. We should probably expect significant resistance should the dollar make a run towards $92.63.
While the dollar technical indicators indicate the buck is overbought, that doesn’t necessarily mean it’s impressive run higher is over yet.
Bullion.Directory or anyone involved with Bullion.Directory will not accept any liability for loss or damage as a result of reliance on the information including data, quotes, charts and buy/sell signals contained within this website. Please be fully informed regarding the risks and costs associated with trading in precious metals. Bullion.Directory advises you to always consult with a qualified and registered specialist advisor before investing in precious metals.


