

Despite the recent move down in the dollar and move up in gold, their trends remain essentially the same
 Bullion.Directory precious metals analysis 25 March, 2015
By Terry Kinder
Investor, Technical Analyst
The U.S. Dollar has dropped from over $100.00 to under $97.00. Meanwhile, the gold price is knocking on the door of $1,200.00 again. Despite these facts, the primary trends for both remain in place – gold remains in a downtrend while the dollar uptrend has not been derailed.
Dollar Pitchfan
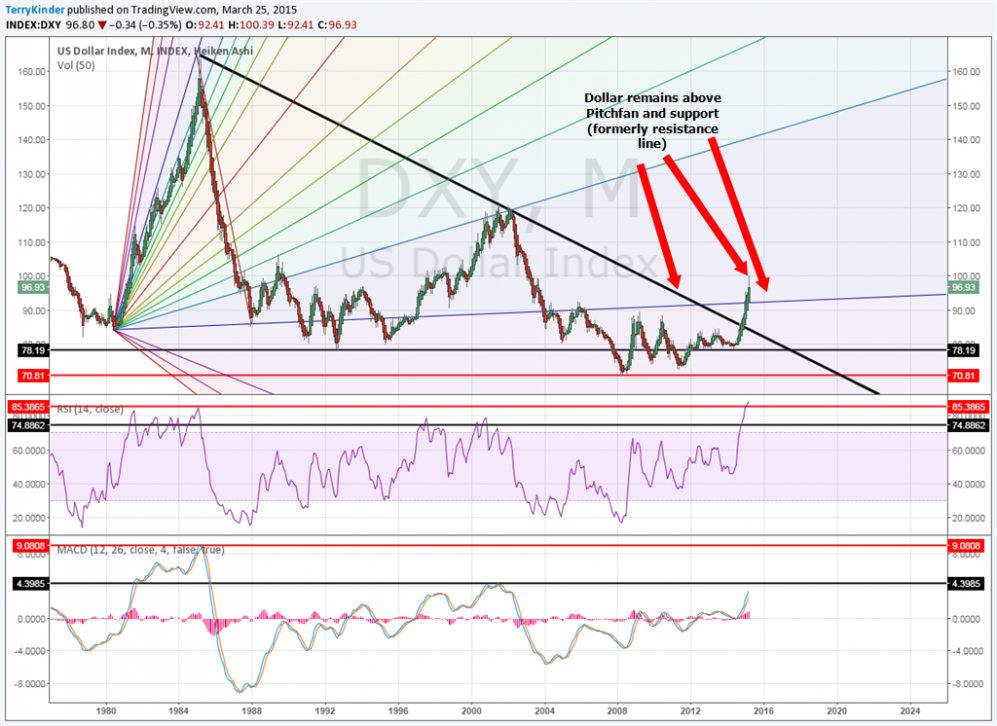
Dollar is holding above both the Pitchfan support level and the old resistance (now support) level
Looking at the Dollar Pitchfan (combination pitchfork and Gann Fan) chart, the dollar remains above both Pitchfan support and it’s formerly long-term resistance – now support. The recent decline in the dollar has done nothing to change the strong dollar uptrend on this chart.

Dollar Squares
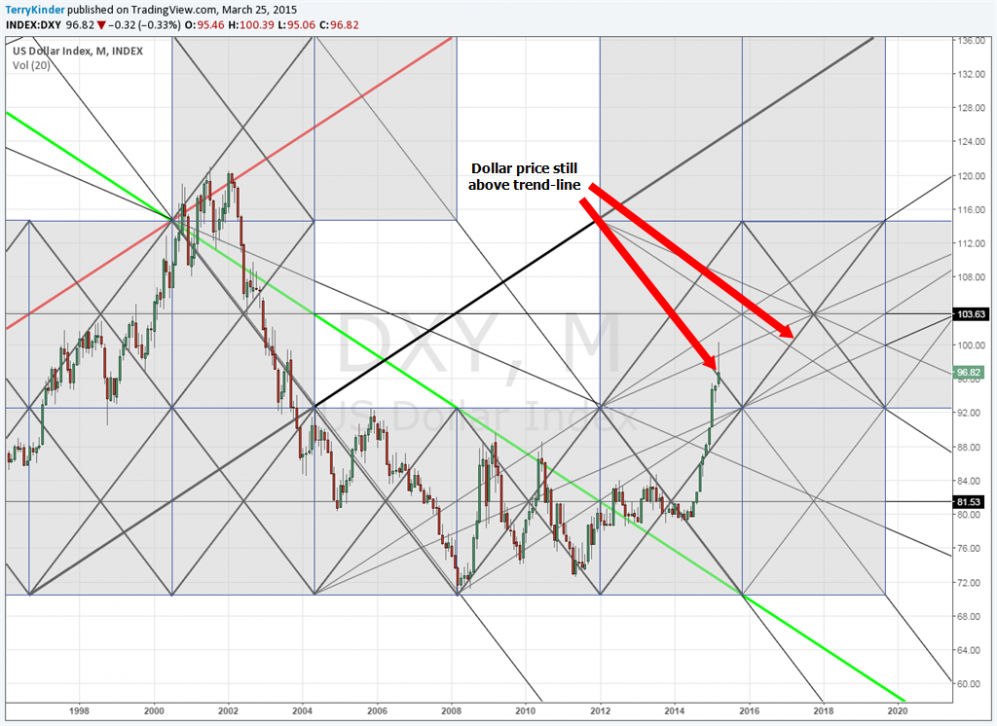
Despite the recent pullback, the U.S. Dollar is well above its trend-line
Our second chart of dollar squares presents a similar picture to the previous chart. The dollar remains well above its trend-line. Price did pull back a bit at a natural level of resistance, but it remains both above the downward sloping resistance and upward sloping support lines.
Gold Triangles, Price Head Fakes
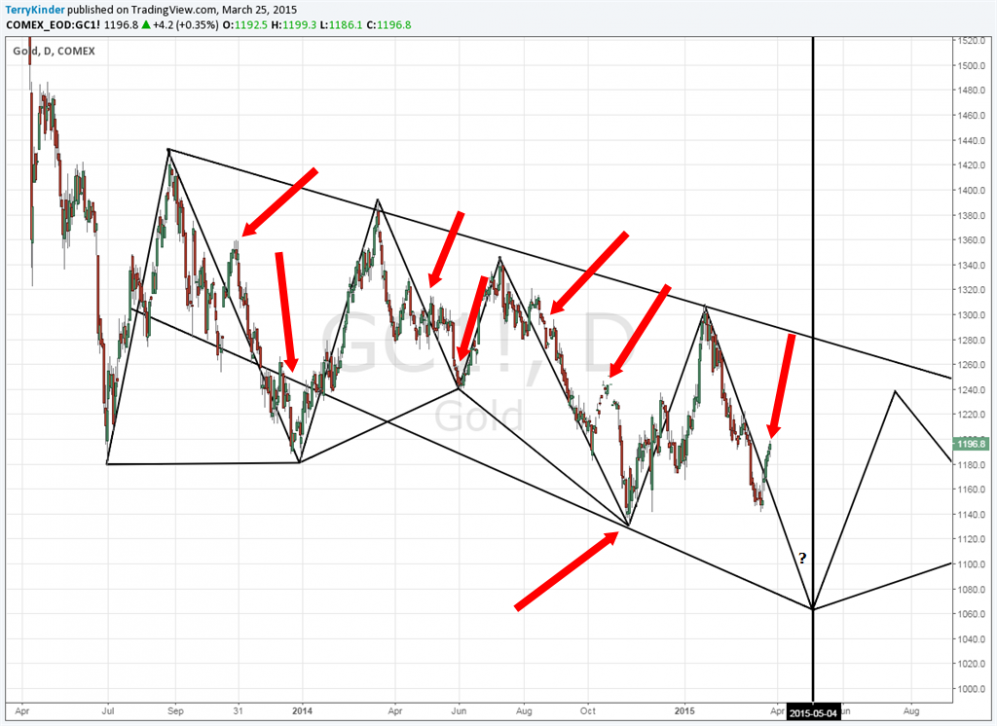
Gold price triangle head fakes. Every time it looks like the price is breaking higher, it drops
The gold price, since around the middle of 2013, has had the habit of head faking the market by moving above a series of triangle patterns, only to later fall back to the trend indicated by the triangle(s). This has happened over and over again. Moreover, there is a very distinct overhead price resistance line running from triangle top to triangle top. Thus far, the gold price has not been able to break above this resistance line. Until it does, it’s safest to assume that any price movements higher are merely counter-trend movements within the larger primary downtrend.
Gold Pitchfan
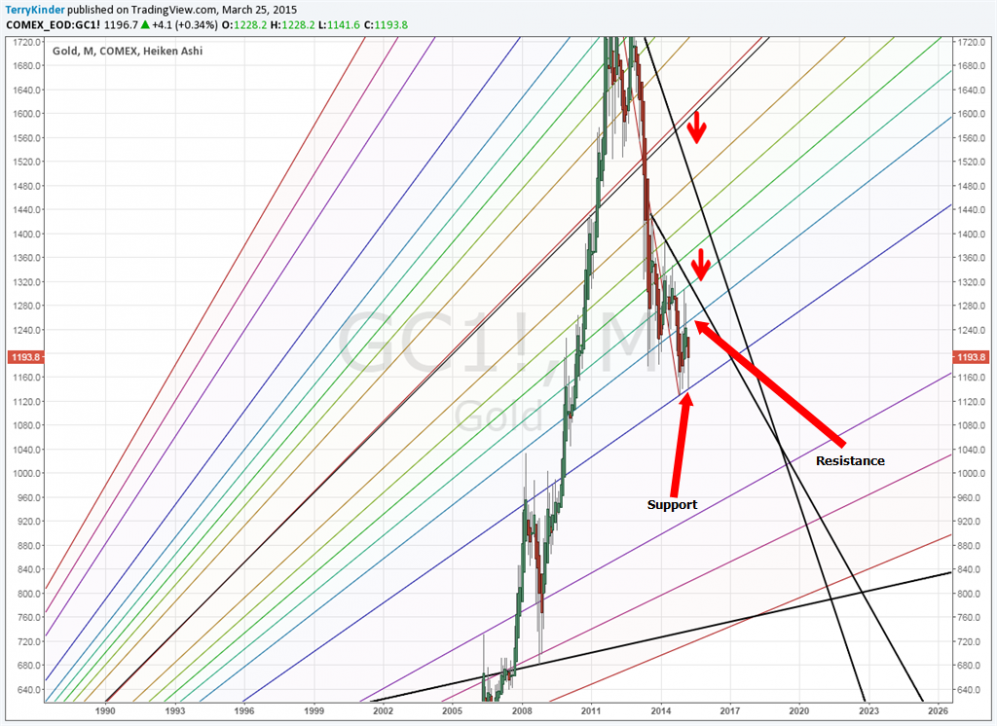
Gold is caught between support and resistance levels of the Pitchfan, but the upward movement of price still restrained by overhead resistance (small red arrows pointing down)
The gold Pitchfan presents a bit more mixed picture. Price has been bouncing off support and resistance lines which slope upwards. The test for the gold price will come when it meets with the two resistance lines pointed out by the two small red arrows. One resistance line dates back to 2011 while the other goes back to 2013. A reversal lower at these lines could result in a sharper drop lower for gold while breaking above the lines for a sustained period of time could mark a change in the primary trend from down to up.
Gold Bumping Up Against Monthly Resistance
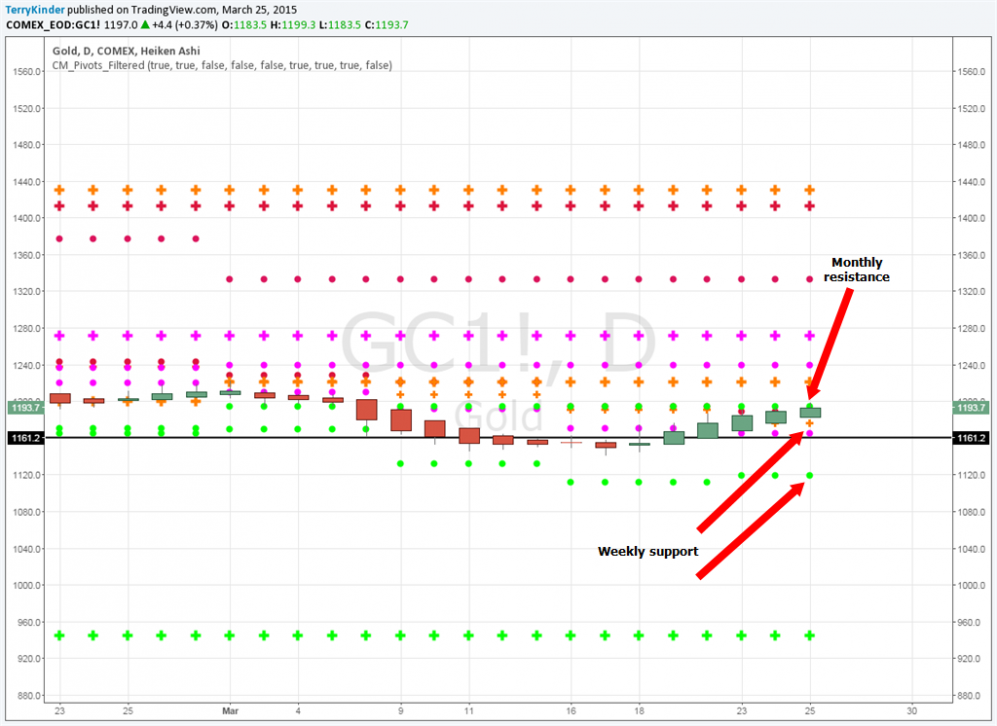
The gold price is bumping up against monthly resistance
On the pivot chart, the gold price is bumping up against monthly resistance. Below the current price, the only nearby support is weekly. So, should the price dip very much, it won’t have any obvious support until yearly support (the green crosses at the bottom of the chart). While I wouldn’t expect such a steep drop, it is good to be aware that below the current price level, at least for this week, there isn’t any longer term support.
Gold Yearly Resistance and Support
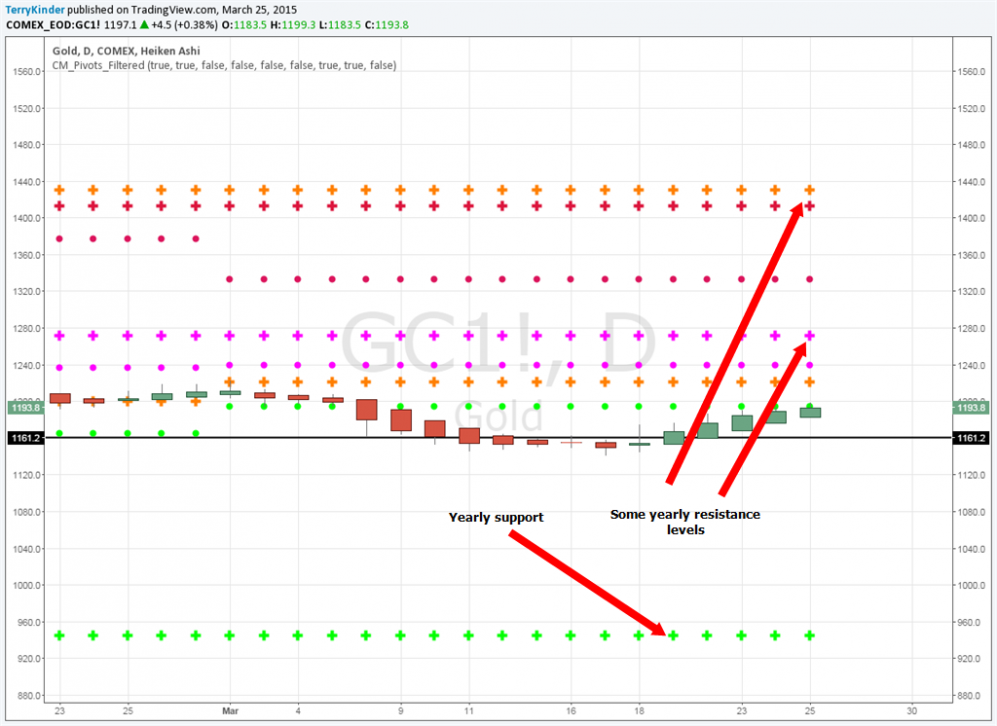
Gold yearly support is quite a bit underneath the current price
Both the yearly price resistance levels, and the one support level, are a significant distance from the current gold price. In fact, the first yearly overhead price pivot resistance level is quite near the overhead resistance level shown on the chart with the gold triangles. This points to the challenge the gold price will face should it continue to move higher through $1,200.00, $1,208.00, $1,212.00, $1,224.00, $1,236.00, etc. I would keep an eye on all of those multiple of twelve price levels as they will likely prove to be important.
Conclusion
Despite the slip in the U.S. Dollar price and the move higher in the gold price, both which have been substantial, they have not changed the primary trends for either.
Going forward, for the rest of this month, gold faces monthly pivot resistance. Overcoming that resistance will be key for the gold price to move higher. The dollar remains well above its trend and support levels. Barring a sharp and significant move lower, its primary trend should continue to be up, despite the current dip lower.
Bullion.Directory or anyone involved with Bullion.Directory will not accept any liability for loss or damage as a result of reliance on the information including data, quotes, charts and buy/sell signals contained within this website. Please be fully informed regarding the risks and costs associated with trading in precious metals. Bullion.Directory advises you to always consult with a qualified and registered specialist advisor before investing in precious metals.


