

Dollar Gold Chart Update 1-1-2015
 Bullion.Directory precious metals analysis 2 January, 2015
By Terry Kinder
Investor, Technical Analyst
The U.S. Dollar Index (DXY) has been in a clear uptrend since 2011, which not coincidentally marked the beginning of the gold price sliding lower. We look at this and more in our dollar gold chart update for 1-2-2015.
Dollar Gold Chart Update
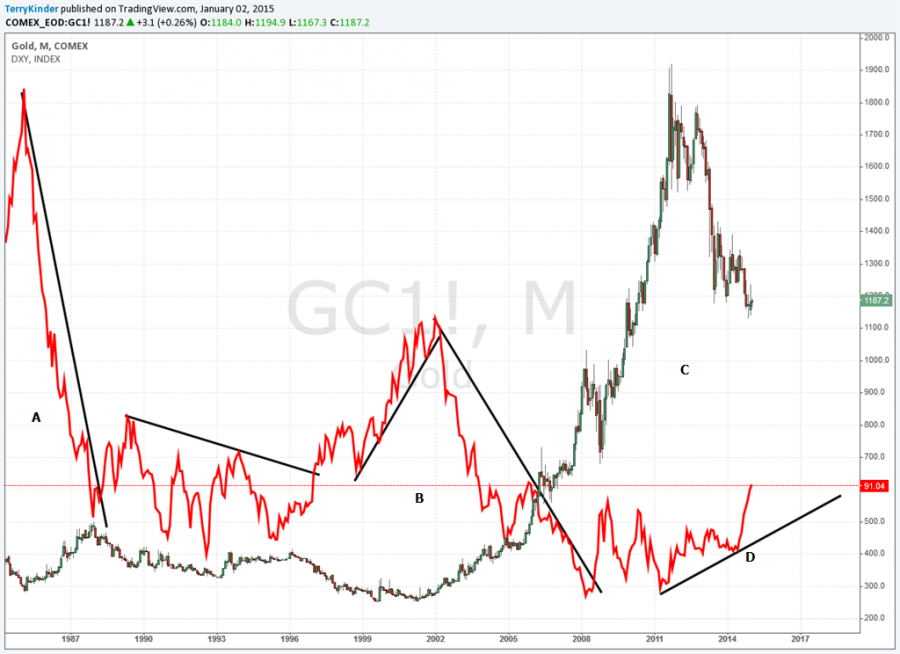
Dollar Gold Chart: The U.S. Dollar’s price uptrend beginning in 2011 marked the peak of the gold price.
It’s pretty clear looking at A, B, and C in the dollar gold chart above that gold and the dollar, generally, move in opposite directions. The U.S. Dollar highs in the 1980’s and again in the 1990’s to around 2002 kept the gold price relatively low compared to today’s price. As the dollar moved to lows around 2008 the gold price began to climb.

Dollar Gold Chart Update: Will the rising dollar reverse anytime soon? Image: pixabay

A good argument can be made that the dollar is overbought. However, the dollar gold chart below demonstrates that during the dollar run ups in the 1980’s and from the 1990’s to 2002, the dollar was able to maintain extremely overbought levels over the course of several years. While nobody knows for certain whether history will repeat itself, it’s worth noting because a multi-year strengthening of the dollar could present an opportunity to purchase gold at significantly lower prices.
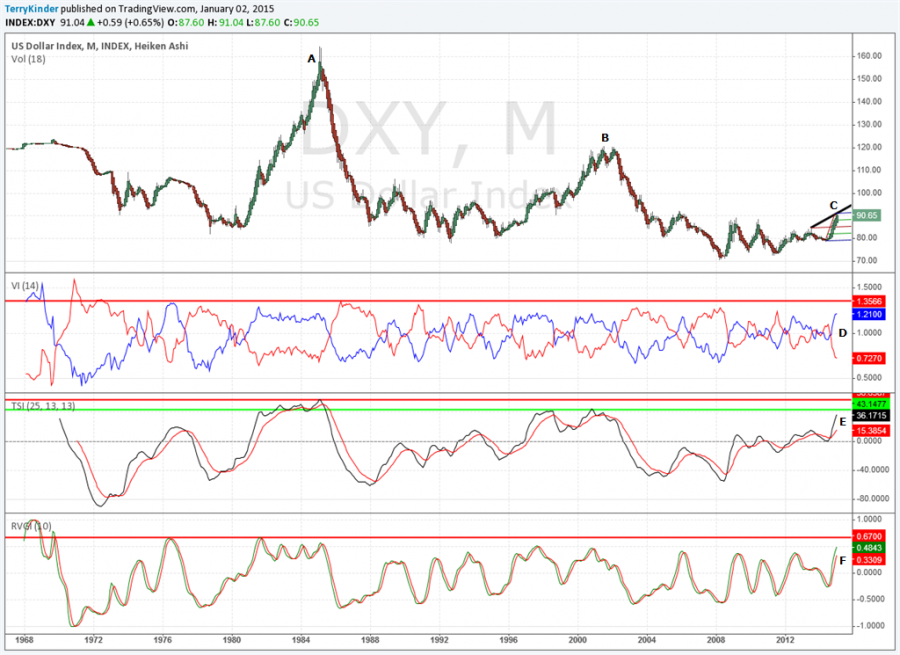
Dollar Gold Chart: While the U.S. Dollar appears to be reaching an extremely overbought level, the indicators highlighted by the red lines, and one green line, indicate that extreme levels can be maintained for several years.
The above dollar gold chart shows the peak in the DXY in the 1980’s at A, and the subsequent smaller peak around 2002 at B. Compared to those previous peaks C doesn’t look like much. The Vortex Indicator (D), True Strength Indicator (E), and Real Vigor Indicator (F) are all at elevated levels, but the red lines, and green line, demonstrate that these indicators can rise to more extreme levels as they did in the past. So, we shouldn’t necessarily assume that these indicators have to reverse lower, although we can’t rule that out either.
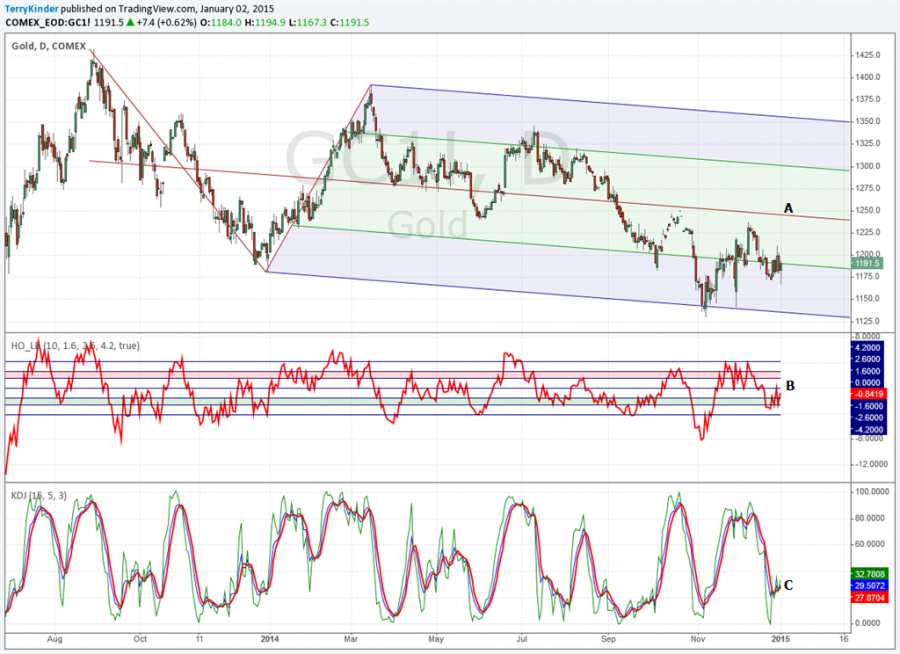
Dollar Gold Chart: Gold spent most of 2014 in a shallow decline as indicated by the Schiff Pitchfork. Price has bounced off the bottom of the pitchfork. The gold price is slightly out of oversold territory as indicated by the Hurst Bands at B. We’ll have a better idea of the strength of the gold price as it approaches the pitchfork Median Line at A. It it touches the Median Line and moves lower, that indicates price weakness. If it can push through the Median Line and head to the upper parallel line that would be a sign of strength.
The dollar gold chart above shows that the gold price has been in a shallow and declining pattern for most of the last year. In this chart we used a Schiff Pitchfork instead of the standard Andrews’ Pitchfork. We did this because an Andrews’ Pitchfork would have created a pitchfork with a steep decline, when in reality the decline has been more shallow. The gold price bounced off of the bottom of the pitchfork around the $1,130.00 and then, later, $1,1140.00 levels. The challenge for the gold price will be whether or not it can move to and then above the Median Line at A. If the gold price touches the Median Line and then moves lower again, that will represent price weakness. The Hurst Oscillator at B and KDJ at C seem to be indicating that the gold price is getting a bit of a bounce, albeit a little weak up to now.
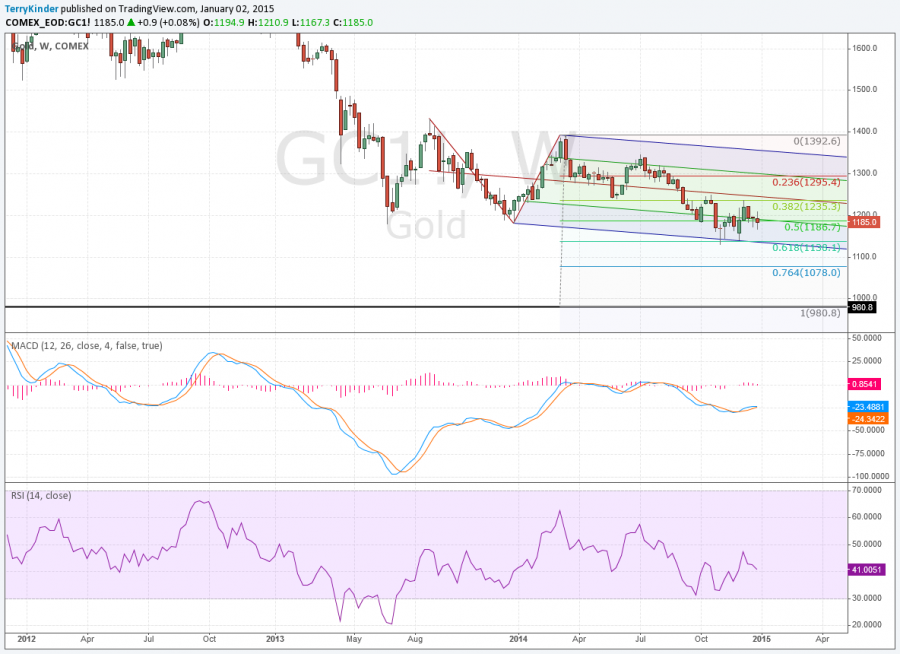
Dollar Gold Chart: At some point the gold price should move back toward the median line around $1,235.30. However, unless the trend changes, the gold price is likely to be bound in between around $1,120.00 and $1,350.00 until the end of March.
As the dollar gold chart above shows, gold has had some challenges holding above $1,186.70 or the 0.50 Fibonacci Retracement Level. Unless we see the gold price falling down out of the Schiff Pitchfork, we should expect that around 80% of the time price will make its way back up to the Median Line which is near the $1,235.30 price level. MACD and RSI haven’t shown much inclination to move higher, but they aren’t oversold yet either.
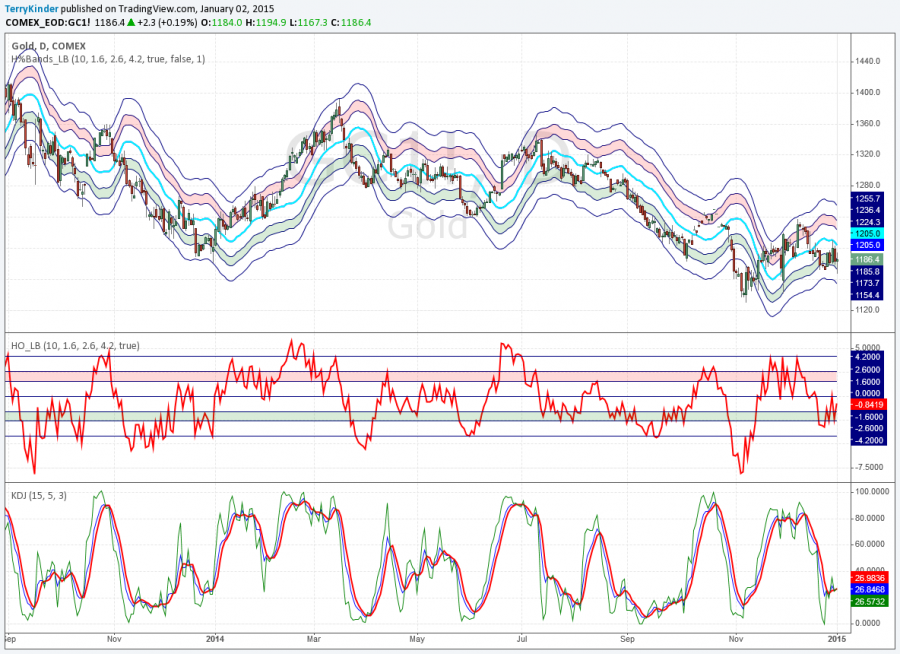
Dollar Gold Chart: The gold price is just above oversold levels as indicated by the Hurst Bands and Hurst Oscillator. The pink overbought Hurst Band indicates it will be difficult for gold to take and hold from $1,200.00 to $1,235.00.
To reinforce what the previous two dollar gold charts emphasized, the above dollar gold chart shows that there is signficant price resistance between $1,225.00 and $1,235.00 as evidenced by the pink colored overbought price band. Currently, if gold rose to the $1,255.70 level it would be extremely overbought. On the other hand, if gold were to move below $1,155.00 it would be extremely oversold.
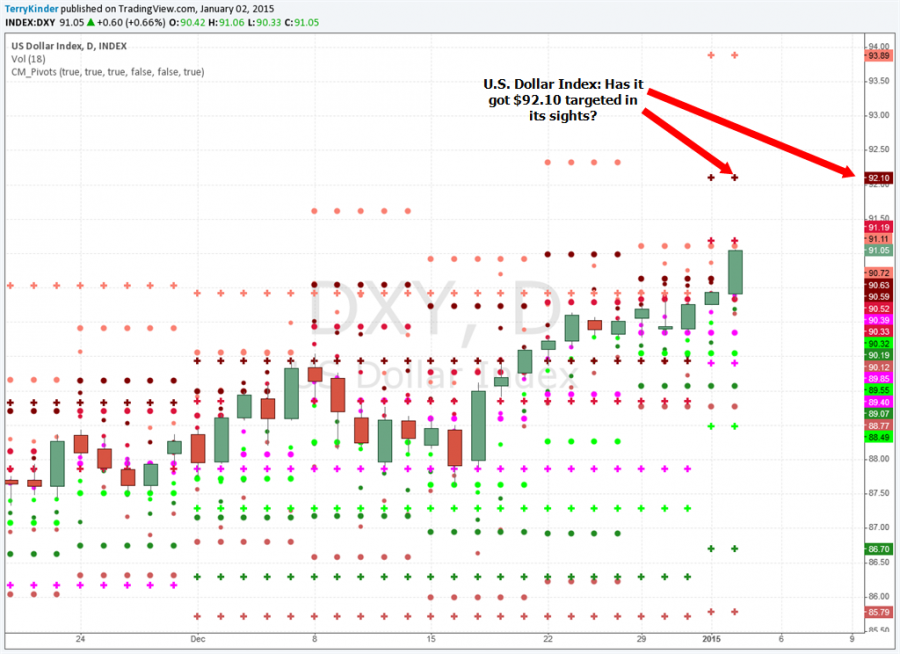
Dollar Gold Chart: The U.S. Dollar Index (DXY) appears to have $92.10 in its sights as indicated in this pivot chart. At this point there isn’t much overhead price resistance above $91.19.
Flipping back to the dollar side of this dollar gold chart update, the pivot chart above shows that the dollar has overcome most of its overhead price resistance. On today’s chart, there isn’t much standing between the DXY and $92.10. Most of the overhead price resistance is monthly as respresented by the + (plus) signs. Should the dollar pierce the $92.10 level and hold it, then it presents the possibility of a run up to $96.00 or above. Each move up in the DXY shifts support levels up, putting a floor under the higher price. This, in turn, exerts downward pressure on the gold price.
Don’t expect over the medium-to-long-term for the U.S. Dollar and gold to decouple. This decoupling may occur over short time periods, but as demonstrated in the above charts, during the 1980’s and 1990’s to 2002 the gold price and dollar largely moved in opposite directions. The U.S. Dollar has been in a clear uptrend since 2011, pushing the gold price lower. During some part of the 1980’s, 1990’s and 2000’s the dollar has had a multi-year move higher. Despite all of the negative talk about the dollar, we could be looking at another dollar bull. The two previous dollar bulls ran approximately 5 and 7 years. If the pattern holds true, then we could be looking at another 1-3 years of a rising dollar and falling gold prices, which could present an ideal opportunity to accumulate more gold at lower prices.
Bullion.Directory or anyone involved with Bullion.Directory will not accept any liability for loss or damage as a result of reliance on the information including data, quotes, charts and buy/sell signals contained within this website. Please be fully informed regarding the risks and costs associated with trading in precious metals. Bullion.Directory advises you to always consult with a qualified and registered specialist advisor before investing in precious metals.


