What can the Euro gold price tell us about the future of gold priced in dollars?
 Bullion.Directory precious metals analysis 27 October, 2014
By Terry Kinder
Investor, Technical Analyst
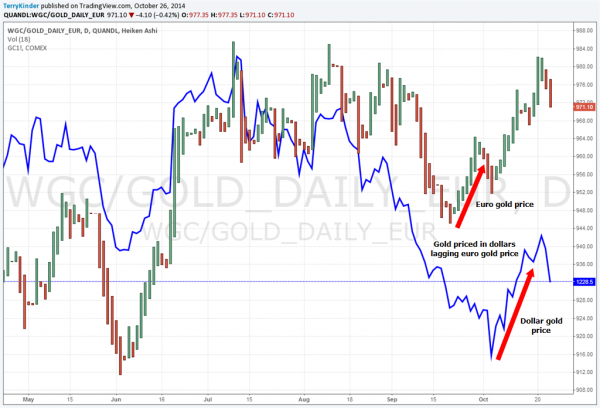
In the chart above, the euro gold price led the dollar gold price by two weeks. So, while it can be easy to track the price of gold in only one currency, it can be useful, and potentially profitable, to track the gold price in more than one currency.
As the euro has slipped lower, the euro gold price has moved higher although it still hasn’t managed to move up through the €1,000 level.
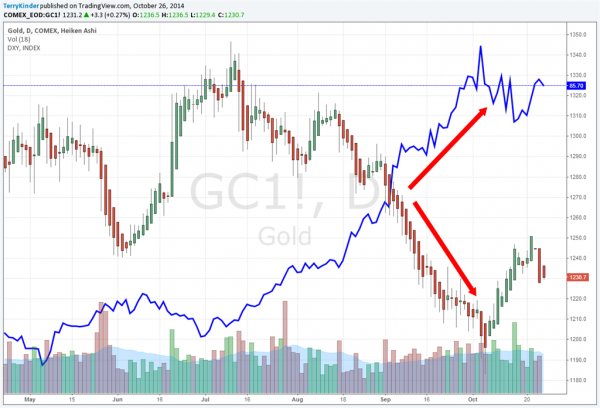
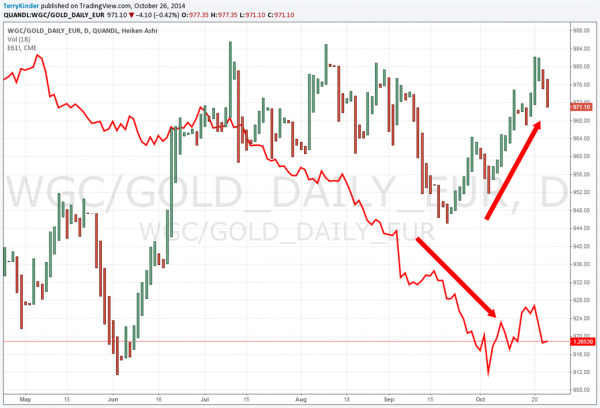
Gold priced in dollars is nearly a mirror image of the euro gold price. As the dollar has climbed higher it pulled the gold price lower.
Gold priced in dollars is practically a mirror image of the euro gold price. In this case as the dollar price moved higher the gold price fell lower.

Not surprisingly, as the dollar has climbed higher the euro has moved down and the euro gold price (as seen in other charts) has moved up.
The higher dollar has pressured the euro lower which, in turn, has moved the euro gold price higher.
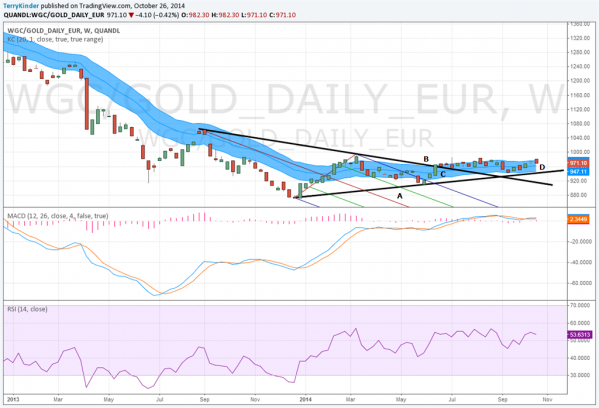
The euro gold price moved out of the Andrews’ Pitchfork and through the price trigger line. It has also managed to stay above the support line drawn from the lower corner of the pitchfork to near the bottom of the Keltner Channels.
So far the euro gold price has managed to stay above support. In the chart above, price moved out the Andrews’ Pitchfork (A) and through the price trigger line (B). The euro gold price has largely stayed within the Keltner Channels (C) which represents mostly sideways price action. Price has also managed to stay above a support line drawn from the lower corner of the Andrews’ Pitchfork to just under the Keltner Channels (D).
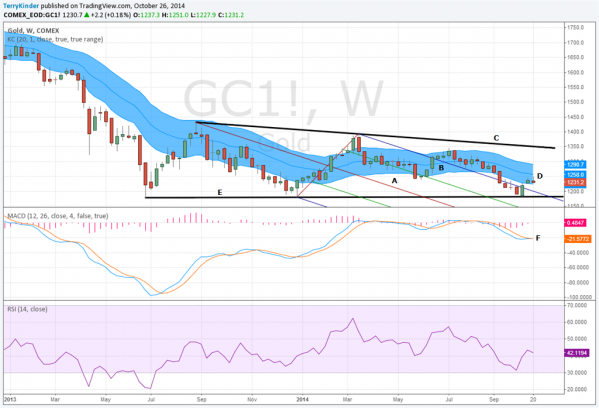
In contrast to the euro gold price, gold priced in dollars has not been able to break above the price trigger (C).
In contrast to the euro gold price, gold priced in dollars has not been able to break above the price trigger (C). On the plus side, the dollar gold price has managed to remain above its support line (E) and also recently re-entered (D) the Keltner Channels (B). So, at least temporarily the dollar gold price has managed to avoid sliding down further. Additionally, MACD (F) appears that it may be ready to head higher although it is still below the zero line.
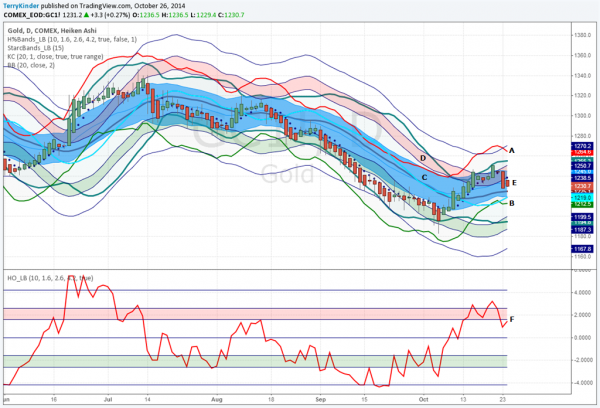
In contrast to the euro gold price, the dollar price of gold on the weekly chart was recently overbought (D).
In contrast to the euro gold price, the dollar price of gold on the weekly chart was recently overbought (D). This overbought status of gold priced in dollars was verified by the Starc – (minus) Band crossing above the middle of the Hurst Channels at B. Gold neared the top of the Keltner Channels (C) but has since fallen closer to the middle of the channels. Another representation of the information displayed in the Hurst Channels can be seen in the Hurst Oscillator (F). This is the exact same information simply displayed in an easy to read linear form.
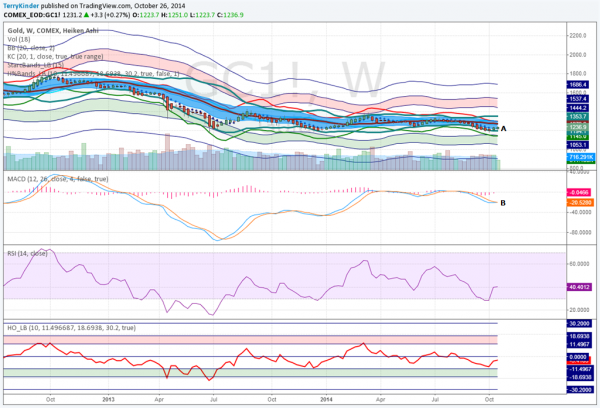
The US Dollar price of gold on the weekly chart appears to be more similar to the euro gold chart in that it remains neither overbought nor oversold.
Similar to the euro gold price, the dollar price of gold on the weekly Hurst Chart is neither overbought, nor oversold. Price rose back into the Keltner Channels (A) and the MACD, while still below the zero line, appears to be strengthening slightly.
Conclusion:
The euro gold price has recently been leading gold priced in dollars. While the dollar price of gold has been unable to break through its price trigger, gold price in euros has broken above that trigger, but has not yet been able to move above the €1,000 level. At this point I would not expect gold priced in dollars to break above the price trigger line which is currently around the $1,350 level anytime soon. However, I do believe that the dollar gold price could push up toward the top of the Keltner Channels, perhaps to between $1,275 and $1,290 within the next 2-3 weeks.
Keep an eye out for the euro gold price, dollar gold price and the dollar, as represented by the US Dollar Index (DXY) over the next 2-3 weeks as there is likely to be an opportunity for gold priced in dollars to push up between $1,275 to $1,290 before meeting some resistance.
Bullion.Directory or anyone involved with Bullion.Directory will not accept any liability for loss or damage as a result of reliance on the information including data, quotes, charts and buy/sell signals contained within this website. Please be fully informed regarding the risks and costs associated with trading in precious metals. Bullion.Directory advises you to always consult with a qualified and registered specialist advisor before investing in precious metals.




 Material provided on the Bullion.Directory website is strictly for informational purposes only. The content is developed from sources believed to be providing accurate information. No information on this website is intended as investment, tax or legal advice and must not be relied upon as such. Please consult legal or tax professionals for specific information regarding your individual situation. Precious metals carry risk and investors requiring advice should always consult a properly qualified advisor. Bullion.Directory, it's staff or affiliates do not accept any liability for loss, damages, or loss of profit resulting from readers investment decisions.

Leave a Reply