

The displaced moving average is one of the most simple and powerful tools to forecast future price. Better yet, you don’t need to buy an expensive software program or be a genius to use it to forecast prices. We will use the COMEX continuous gold contract price as an example of how easy it is to forecast future prices with the displaced moving average.
 Bullion.Directory precious metals analysis 27 October, 2014
By Terry Kinder
Investor, Technical Analyst
1. Your first step is to go online to TradingView and sign up for a free account.
2. Once you have signed up for your account on TradingView you can click on Chart –> New Chart.


Using a displaced moving average in TradingView is easy. To start you will need to create a new chart.
3. Enter in what you want to create a chart of. In this case we type in GC1! for the COMEX continuous gold contract, although you could also simply type in gold and then scroll through the list to find what you want also.
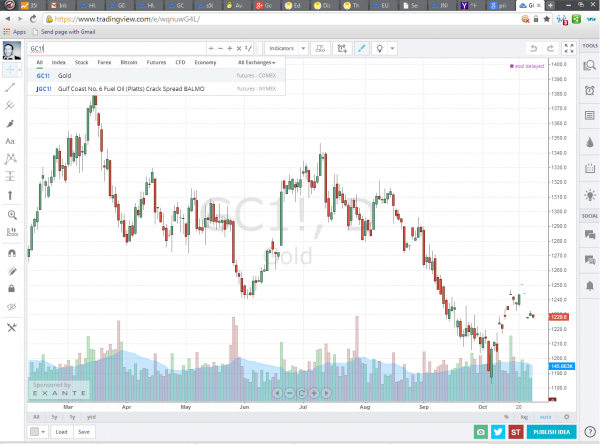
The next step in creating our chart with a displaced moving average is to select our instrument. In this case we type in GC1! which is the COMEX continuous gold contract. If we weren’t sure what we were looking for we could simply type in gold and then scroll through the list.
4. Next you need to create your displaced moving average, actually there will be three, on the chart. To do so, first click on indicators.

The next step to placing your displaced moving average, actually there will be three, on the chart is to select indicators.
5. Then type moving average into the box. Click to the right where it says moving average. This will be the simple moving average, which is what we want.

To set up our displaced moving average, actually there will be three, we have to type in moving average under indicators and then select it from the list.
Click twice more because you’re going to want to a total of three simple moving averages on your chart. Below you can see what your chart should look like at this point.

We have placed three simple moving averages on our chart so far, but you probably only see one moving average line. This is because we haven’t changed the lengths of the moving averages. We will change each moving average and make it a displaced moving average in the next step. When we are finished, we’ll have three displaced moving average lines on the chart.
6. Now we are going to make changes to each of our simple moving averages to make each a displaced moving average. We’ll go through the steps to change one of them, and then you can change the other two as outlined below. Once we do that, we’ll be ready to calculate a price forecast. First, we need to click on the gear next to our first moving average.

To change our moving average to a displaced moving average we first click on the gear by the average we want to change.
Next we will select the color we want our displaced moving average line to be by clicking on the colored box. We’re going to select blue from our color choices.
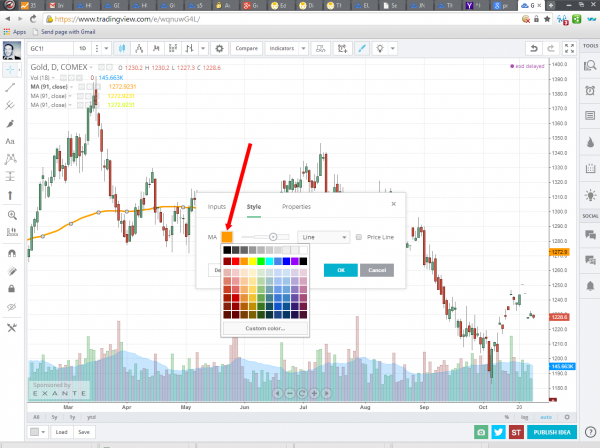
Now we click on the colored box by where it says MA for moving average. We’ll select blue from our color choices.
Select the inputs tab to go to the step where we will set our first displaced moving average.
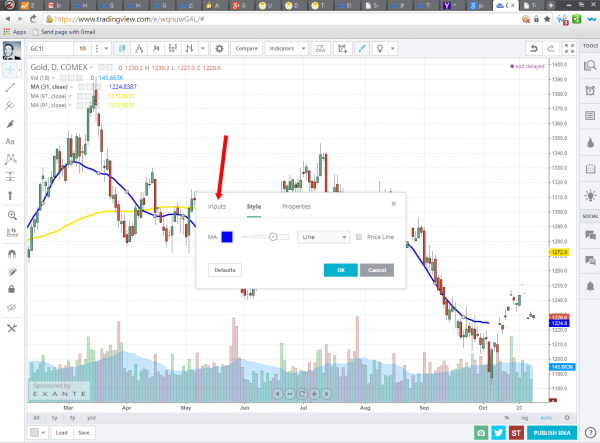
You should now have a blue box. Click the inputs tab where we will set up our displaced moving average.
In the inputs tab we will change the length to 31 days and the offset to – (negative) 16 days. Doing this moves the moving average to the left, back in time, creating the displaced moving average. Be sure to click the OK button.
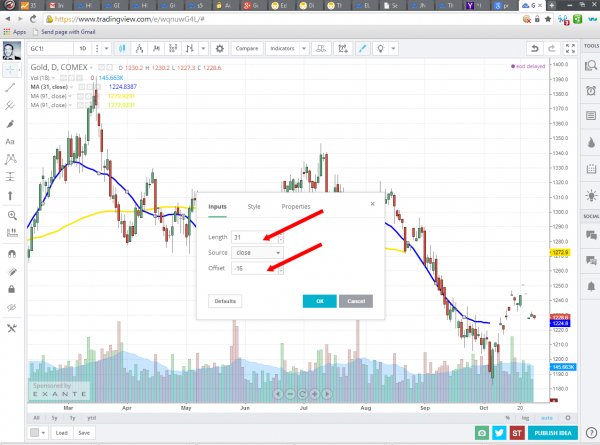
To create our first displaced moving average we make the length 31 days and the offset is – (negative) 16 days.
We repeat the steps above, choosing a different color for each displaced moving average. Our other two displaced moving averages will be 61 days with a -32 day displacement and 91 days with a -46 day displacement. When we are finished you should have something similar to below.
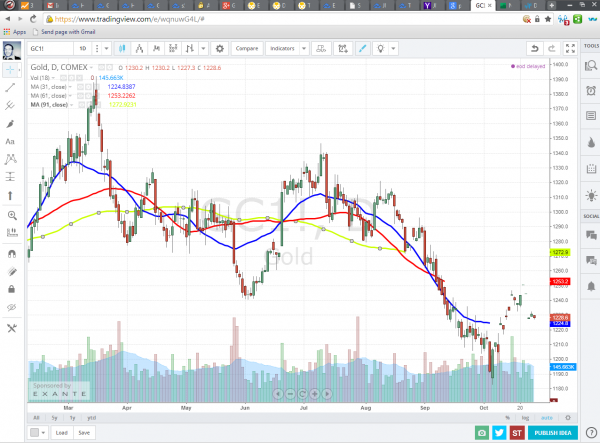
After creating each displaced moving average your chart should look something like the above.
7. Now you will select the tool that allows you to draw a trend line. Click on the first option, trend line to use that tool. We will then draw a trend line from the end of the 91-day displaced moving average to where it would cross the 31-day displaced moving average. This is somewhat of a judgment call. We would also do the same with the 61-day displaced moving average, however, in this case, it has already crossed the 31-day so there is no need to do so.
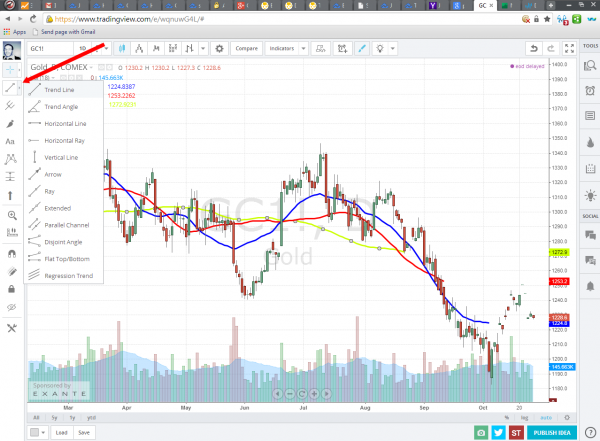
Select the trend line drawing tool. You are going to draw a trend line from the end of the 91-day displaced moving average to where it would cross the 31-day displaced moving average in the future. This is somewhat of a judgment call. Try to draw the line as close to what you believe it would look like based on its current path.
When you are done you will get something similar to the chart below. I have also noted some important price levels: A) A pivot high at $1,346.80; B) $1,270.60 at the point where the 91-day displaced moving average crossed over the 31-day one; and C) $1,258.50 where the 61-day displaced moving average crossed the 31-day one.
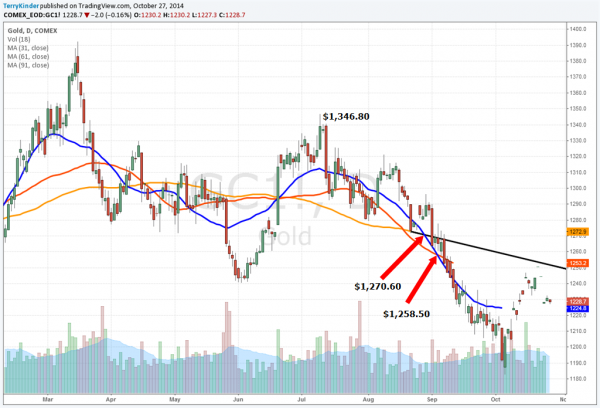
On this chart we have each displaced moving average, along with some numbers marking where a pivot high occurred and where each displaced moving average crossed the other one.
8. Finally we have reached the point where we can use the displaced moving average crossovers to calculate a price target. Normally we would do this before price reached a bottom, but doing so won’t change our price projections by much. Following are the calculations we would make to forecast what, in this case, the pivot (or interim) low price for COMEX continuous gold would be.
A. Take our pivot high of $1,346.80 and subtract where one displaced moving average crossed the other. We have two different crosses so we’re going to use each one and then average the results at the end. So, our first crossover was at $1,270.60. Subtract $1,270.60 from $1,346.80 to arrive at $76.20. Now subtract $76.20 from $1,270.60 (the point where the first crossover occurred) to arrive at $1,194.20.
B. Repeat the steps above only with the second crossover. In this case we subtract $1,258.50 from $1,346.80 to arrive at $88.30. Now, subtract $88.30 from $1,258.50 to arrive at $1,170.20.
C. We don’t often get two crossovers as we did here, but since we have them, let’s calculate the average by adding our projections of $1,194.20 and $1,170.20 together and then dividing them by two. $1,194.20 + $1,170.20 = $2,364.60 / 2 = $1,182.30. What was the actual pivot low for COMEX continuous gold? The actual pivot low was $1,182.80. The difference between our projection and the actual pivot low price was $0.50. Normally, the projected price would not be that close to the actual price, but it is quite normal for the projection to be within two or three dollars of the actual price.
So, there you have it. You can project prices like a professional and not spend a penny on expensive software, plus you only need a calculator, pen or pencil and paper to make the calculations.
Whether you’re a precious metals “stacker”, a stock trader, or you trade currencies, futures, etc. you can learn to project future prices like a professional. The only additional cost is the time you invest to learn how to do so.
Bullion.Directory or anyone involved with Bullion.Directory will not accept any liability for loss or damage as a result of reliance on the information including data, quotes, charts and buy/sell signals contained within this website. Please be fully informed regarding the risks and costs associated with trading in precious metals. Bullion.Directory advises you to always consult with a qualified and registered specialist advisor before investing in precious metals.


Thank you for explaining something I’ve never known how to or where even to start. I’m fairly new to precious metals and so far all I’ve ever really done is look at live prices and guess what’s going to happen based on news and what analysts are saying. Do you think this could be expanded and perhaps made even simpler for the likes of me, for example I don’t know what a pivot point is or some of the other terms used. I always like your analysis on this site because it doesn’t baffle with too many terms so I know that if there was a really basic add on sister piece to this it would be SO useful. Maybe even if rather than being an article that can get lost it could move to a place where it’s a resource as Im sure there are others who need this. I looked up the glossary but it needs a glossary to explain itself!
Hi Mary. Thanks for your comments. I will see if I can either modify the original article, or perhaps write a sister article to go along with the original. I had also considered perhaps doing a screen-cast video to show the steps to create the price forecast. I think you are right about the article being a potential resource and it is my understanding as more of these kinds of articles are written they will likely get their own “home” so they can be more easily found. I’ll also try and remember in the future to define terms or place links in the article to explain them. It’s easy to forget sometimes that the amount of different terms in articles about technical analysis can get a little overwhelming at times. Really appreciate your feedback.