What do US Dollar technicals tell us about the future price of the dollar and where the price of gold might be headed?
 Bullion.Directory precious metals analysis 23 September, 2014
By Terry Kinder
Investor, Technical Analyst
In Dollar Hollers – What does it say?, Market Anthropology makes the case that the US Dollar is in the last third of its move higher, rather than on the cusp of a 1990’s style bull market.
Paul Tudor Jones, once fittingly observed, “Fundamentals might be good for the first third or first 50 or 60 percent of a move, but the last third of a great bull market is typically a blow-off, whereas the mania runs wild and prices go parabolic… There is no training, classroom or otherwise, that can prepare for trading the last third of a move, whether it’s the end of a bull market or the end of a bear market.”
Previously, we had taken a look at the US Dollar technicals and trend in US Dollar Trend Looking Up.
In that article we listed a few important US Dollar Index (DXY) prices to keep an eye on. The closest upside and downside prices are listed below.
Upside:
$84.92 – $85.00
Downside:
$83.74 – $83.82
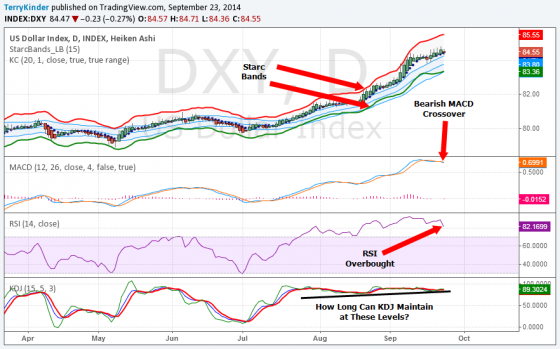
Interestingly enough, the dollar has traded between the nearest upside and downside targets. The fact that the dollar has not yet challenged the $84.92 – $85.00 range may indicate the upward impulse of the dollar is weakening, and that the US Dollar technicals may not be strong enough to push through that level of price resistance.
Some noteworthy features of the above US Dollar technicals chart are:
1) Bearish MACD crossover;
2) RSI is overbought;
3) KDJ indicator levels quite high.
Market Anthropology’s US Dollar chart makes it clear that the US Dollar faces some strong overhead price resistance.
They also offer up this relevant comment on the trajectory of the US Dollar:
With the US dollar index now flirting with the topside of its long-term range, a break above might imply that the move was not the last third – but a new game altogether. Considering the juxtaposition of the Fed withdrawing its fire brigade as the rest of the world turns up their hoses – how likely does that seem?
Near the end of their post they add:
With the ECB now finding religion and the Chinese seemingly not far behind, the shear stresses that have engendered a positive skew in the US equity markets and dollar, should diminish as the Fed walks away. Moreover, we find it noteworthy that the conventional wisdom in the euro today now echoes the expectations from earlier in the cycle for the dollar: that the currency would be pressured lower by Fed policy.
You should read the whole short post. Like everything on their site, it is well worth your time.
Note: Market Anthropology’s analysis is generally spot on. If they think the US Dollar price is going to decline, you probably should not bet against them.
Conclusion:
US Dollar technicals appear to be weakening. The failure of the DXY to push up to and through the $84.92 – $85.00 level is an indication that the price impulse higher may be weakening. Should US Dollar technicals start to slip, look for $83.74 – $83.82 to be the next price support level.
It appears that US Dollar technicals may not be able to push the dollar price higher. If this is the case then it will likely prove positive for the price of gold in US Dollars.
Bullion.Directory or anyone involved with Bullion.Directory will not accept any liability for loss or damage as a result of reliance on the information including data, quotes, charts and buy/sell signals contained within this website. Please be fully informed regarding the risks and costs associated with trading in precious metals. Bullion.Directory advises you to always consult with a qualified and registered specialist advisor before investing in precious metals.


 Material provided on the Bullion.Directory website is strictly for informational purposes only. The content is developed from sources believed to be providing accurate information. No information on this website is intended as investment, tax or legal advice and must not be relied upon as such. Please consult legal or tax professionals for specific information regarding your individual situation. Precious metals carry risk and investors requiring advice should always consult a properly qualified advisor. Bullion.Directory, it's staff or affiliates do not accept any liability for loss, damages, or loss of profit resulting from readers investment decisions.

Leave a Reply