

Some rallies, being breathers within declines – are not bullish – and that’s what we see in gold and silver today.
 Bullion.Directory precious metals analysis 06 January, 2023
By Przemysław K. Radomski
Founder of GoldPriceForecast.com
Before moving to the precious metals sector, let’s take a look at the currency markets as what’s happening there is one of the key building blocks for the situation in the gold, silver and miners.
Starting with the most recent events, we see that the U.S. currency has been moving relentlessly higher in the last several days.

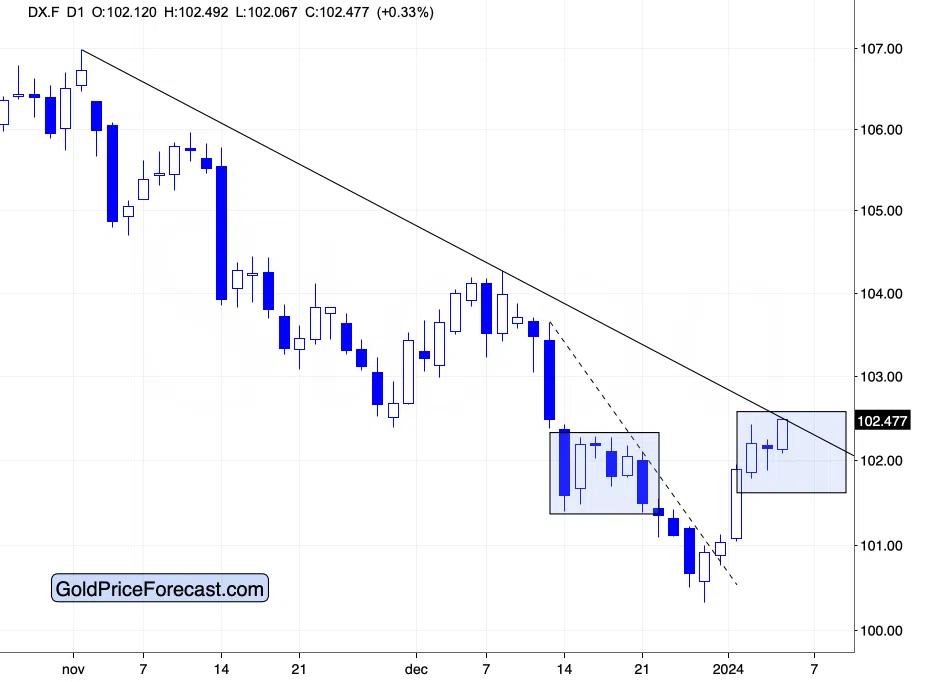
Given the sharpness of the initial part of the rally, a breather was likely to take place, and indeed it materialized. The thing is that yesterday’s pause – because that’s when that breather took place – was tiny. The USD Index declined in the late trading on Wednesday and then early on Thursday, but ultimately the size of the entire decline was negligible. These kinds of corrections characterize the strongest of rallies, and it seems that’s exactly what we have here – a very strong rally.
Now, since the USD Index just approached its declining resistance line, we might (or might not) see a several-day long pause. If we see it, it would be something natural, and the end result could actually be bullish.
The reason is that USDX’s pause here could mirror the pause that we saw in the second half of December (marked with rectangles), which would both serve as shoulders of an inverse head-and-shoulders pattern – that’s a bottoming formation.
This is in perfect tune with what I wrote previously, and those comments still remain up-to-date – they continue to support even higher USDX values.

Let’s check the facts:
- The USD Index is after a sizable, short-term decline, which caused it to be very oversold in RSI terms.
- The last two times, when the RSI was similarly oversold, immediately preceded bottoms and rallies (including the yearly bottom).
- The USD Index is slightly above the all-important 100 level, which serves as a strong support due to psychological reasons (everyone notices it as it’s a perfectly round number).
- The USD Index is at its previous bottoms – each time the USD Index got close to the current levels in 2023, it then bottomed and rallied.
- It’s very close to the turn of the month, and the USD Index has a strong tendency to reverse its course close to those moments (as marked with blue, dashed lines). Since the last move was to the downside, the reversal has bullish implications.
There is one additional clue on the long-term chart.

It’s the rising, long-term support line that started in 2011. It was reaching this line that triggered the reversal and caused the yearly bottom to form. Precisely, the USD Index broke slightly below this line, and it was the invalidation of the breakdown that created the bottom.
The USD Index is EXACTLY in the same position right now!
We just saw the invalidation of the breakdown below the rising, long-term support line – we once again saw the key buy signal!
Since gold was recently willing to decline even while the USDX was moving lower… Gold is likely to truly plunge (and the same goes for other commodities, like natural gas, the key industrial metal – copper, even uranium) when the USD Index finally rallies. And it looks like those price moves have already started.
Also, to make the outlook for the USD Index even more obvious, please keep in mind that USD Index’s biggest component, the EUR/USD formed a bearish pattern, suggesting a quick reversal – and that’s exactly what we saw.

The European currency moved once again to its early-2023 top, thus likely creating a multi-top pattern. This has been a common way for the EUR/USD to top and I marked the previous cases on the above chart.
In 2008 and in 2011 there were sharp, final comebacks to this level before the decline continued. The one in 2014 was small, but it was still there, and the same goes for the one seen in 2021.
What might see chaotic or a game-changer from the short-term point of view, often becomes normal and orderly when looked at from a bigger perspective.
In fact, the above sentence might be one of the key benefits that professional analyses offer. Thanks to being able to view the bigger picture, and to having a broader perspective (thanks to knowing what to focus on), experienced analysts are able to see the situation as it is, instead of “feeling” what the market is currently “feeling”, which is what most (especially beginning) investors do.
Remember the Gamestop craze?

Many people bought into the rally hoping for a “todamoon” scenario. Indeed, the share value moved higher initially, but when the vast majority of people jumped on the bandwagon (as we see in volume readings), it was already too late – that was the top.
Back then, I wrote that this rally was unsustainable, and I wrote the same thing about silver’s short-term rally that we saw at that time… And people were laughing at me when I wrote that while the reasoning behind silver’s WHY – as to why it should rally – was correct, the timing was completely wrong. They didn’t laugh for long, as that was indeed a top, and higher silver prices were not seen since that time.
In early 2021, I wrote that if people wanted to push silver higher, they would need to do it when it was already strong on its own (after a huge decline), and not during a medium-term move lower.

What happened then?
What pretty much always happens after the investment public gets particularly excited about something. We saw a top while silver futures moved slightly above 30 and SLV topped on huge volume – just like it did in 2011.
Looking at historical analogies (note the markings on the above SLV chart) made it obvious that this was a top in the making, and yet, it was nearly impossible to convince people that this huge-volume rally was actually not bullish.
And the historical analogies tell us something very important also this time.
The recent back-and-forth movement in silver is similar to what silver did in late 2012 and early 2013, but that’s just the final part of a long-term analogy.
The final tops (2011, 2021) formed on huge volume, and that was preceded by an initial volume spike. Then the SLV ETF declined in a back-and-forth manner, where we saw 9 bigger highs and lows. Then, after the final (9) top, silver declined in a back-and-forth manner in a smaller range.
We see the same thing right now. The current price movement is what preceded one of the biggest declines in silver’s recent history, so it’s difficult to view the recent performance as something bullish.
The analogy to 2011-2013 had very bearish implications for the following weeks and months, so the implications here are bearish, not bullish.
Yet, just as it was difficult to view silver’s 2021 rally as a top, it’s difficult to view the recent back-and-forth movement in silver as an indication of the upcoming decline – a really big decline.

The fact that silver just broke below its head-and-shoulders top pattern makes the short-term outlook bearish, and given the above-mentioned context, we can say that the medium-term picture is profoundly bearish as well.
I previously wrote that silver could pause after breaking below the pattern, and it that’s what happened. The corrective upswing was not huge, suggesting that the silver market is weak, and that it’s about to slide quite profoundly.
Today’s close will most likely be the third consecutive close after the breakdown and seeing it will imply that the breakdown was complete. This will have very bearish consequences for silver (as well as gold and mining stocks) for the following week.
Moreover, the short-term performance of junior mining stocks confirms that we might not need to wait for long before the slide continues.

The reason is not only mining stocks’ invalidation after trying to break above the December and July highs, and it’s not only miners’ general weakness relative to gold.
It’s also because junior miners just moved below their rising support line, and then they verified the breakdown by moving back to this line without invalidating the move.
In yesterday’s analysis I wrote the following:
I told you that this was the likely outcome, when very few wanted to believe that and… That’s what juniors did.
The GDXJ closed the day below $36, and it’s after the breakdown below it’s very short-term (marked with orange) support line. During yesterday’s session, juniors moved below this line, then they moved quickly back to it, and then they declined once again. That’s a tiny – but still – verification – of the quick breakdown. The decline can now continue, but another move to this level is not out of the question, either.
I previously wrote that our winning streak of 11 closed profitable (unleveraged) trades is likely to get longer, and yesterday’s slide in the GDXJ definitely confirms it.
Congratulations on staying strong and patient when juniors were moving higher, and it “felt” like they were breaking to new highs. It was a trap, and you didn’t fall for it.
Indeed, we saw another small move back to the rising resistance line, and it didn’t change anything. Actually, the fact that junior miners moved back to this line without moving above it makes the short-term picture more bearish.
In today’s (Friday’s) early trading, we saw a rally based on the higher-than-expected nonfarm-payroll readings, but all it managed to do was to once again verify the breakdown below the rising support line. Consequently, what I wrote above remains up-to-date – today’s rally, didn’t change it.
Exciting times are ahead – that is unless one “follows the herd” that often gets on the wrong side of the trade at the exact reversal point…
You know when people will be most reluctant to buy? At the bottom.
And that’s where we plan to buy aggressively.
Przemyslaw Radomski


Przemyslaw K. Radomski, CFA, has over twenty years of expertise in precious metals. Treating self-growth and conscious capitalism as core principles, he is the founder of GoldPriceForecast.com
As a CFA charterholder, he shares the highest standards for professional excellence and ethics for the ultimate benefit of society and believes that the greatest potential is currently in the precious metals sector. For that reason it is his main point of interest to help you make the most of that potential.
This article was originally published here
Bullion.Directory or anyone involved with Bullion.Directory will not accept any liability for loss or damage as a result of reliance on the information including data, quotes, charts and buy/sell signals contained within this website. Please be fully informed regarding the risks and costs associated with trading in precious metals. Bullion.Directory advises you to always consult with a qualified and registered specialist advisor before investing in precious metals.


Leave a Reply