Could divergence on the weekly gold chart signal higher prices to come?
 Bullion.Directory precious metals analysis 16 October, 2014
By Terry Kinder
Investor, Technical Analyst

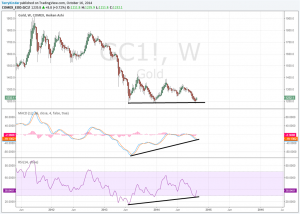
A significant divergence between the COMEX continuous gold price and both the MACD and RSI has developed on the weekly gold chart.
As you can see in the chart above, the gold price has bounced up and down, but overall has remained flat since June.
In contrast, MACD and RSI are both sloping upward creating a bullish technical divergence.
There are at least two ways the weekly gold chart divergence can go:
1) The gold price will rise to match the rising MACD and RSI indicators;
2) The MACD and RSI indicators will fall to match the falling gold price
Jordan Roy-Byrne, CMT thinks that the gold price will fall further.
Given the recent King Dollar smackdown, and how the daily and weekly gold charts are shaping up, I don’t necessarily think the gold price has to fall lower than it has already.
Look for the divergence on the weekly gold chart to resolve. The most likely resolution of the gold price would be higher on a weekly basis to match the rising MACD and RSI indicators.
Bullion.Directory or anyone involved with Bullion.Directory will not accept any liability for loss or damage as a result of reliance on the information including data, quotes, charts and buy/sell signals contained within this website. Please be fully informed regarding the risks and costs associated with trading in precious metals. Bullion.Directory advises you to always consult with a qualified and registered specialist advisor before investing in precious metals.


 Material provided on the Bullion.Directory website is strictly for informational purposes only. The content is developed from sources believed to be providing accurate information. No information on this website is intended as investment, tax or legal advice and must not be relied upon as such. Please consult legal or tax professionals for specific information regarding your individual situation. Precious metals carry risk and investors requiring advice should always consult a properly qualified advisor. Bullion.Directory, it's staff or affiliates do not accept any liability for loss, damages, or loss of profit resulting from readers investment decisions.

Leave a Reply