The King Dollar smackdown didn’t just happen this morning. It’s been going on for a long time.
 Bullion.Directory precious metals analysis 16 October, 2014
By Terry Kinder
Investor, Technical Analyst

Night night King Dollar. Back to your nap. pixabay
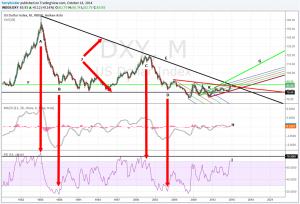
Looking back to 1985, there is a clear trend downward in the price of King Dollar, although there have been moves up to price resistance several times.
Oh how King Dollar has fallen. You probably don’t need to see a bunch of charts to know that a dollar doesn’t stretch quite as far as it used to.
One useful way to look at what a dollar is worth is to look at the dollar price in mg of gold. The fact that the dollar price has more or less steadily declined shouldn’t be a big surprise. The Fed’s goal of 2% inflation, over a 20-year period, would end up devaluing the dollar by 33%.

Perhaps King Dollar is not the measure of all things. pixabay
However, it may not matter because Acting Man believes that credit abuse, aka debt, rather than inflation will ultimately cause the dollar to fail.
In the end, nobody knows what will kill King Dollar, or what the cause will be. Over time, dollar devaluation and high levels of government debt will take their toll on the dollar, monetary system and the larger economy.
Yesterday, in our article about the US Dollar bull pause we noted how the dollar price had remained below a resistance line dating back to 1985.
While the chart might not look quite like cliff diving, it does represent a significant decline in the dollar as represented by the US Dollar Index (DXY).
From around 1985 to present the DXY has declined from over $160.00 to a little over $85.00. If you care to go back to 1913 when the Federal Reserve was established, then the dollar only purchases 3% of what it did in 1913. While the article says 4%, even those who say dollar devaluation is a myth agree that King Dollar is worth 3-5% of what it was worth in 1913.
King Dollar: A look at the charts
Our first chart is from the previously mentioned US Dollar bull pause article.

US Dollar Bull: The monthly is the most complex and interesting chart out of the charts we have seen so far.
We won’t go into all of the details of the chart here. If you want the full details please feel free to read the original article.
However, the noteworthy feature of the monthly DXY chart is the price resistance line dating back to 1985 that has not yet been violated.
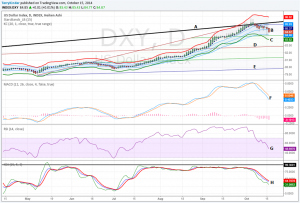
- A – Price trigger line;
- B – Price has moved off of upper parallel channel of Andrews’ Pitchfork toward median line labeled D;
- C – Starc – (minus) band has fallen out of Keltner Channels which indicates the sharp dollar move up has either paused or is over for now;
- E – Should price not bounce at pitchfork median line labeled D, then it will likely move down to the lower parallel channel labeled E;
- F – MACD bearish crossover;
- G – RSI after being overbought for several months finally started falling this month;
- H – KDJ after remaining quite high for several months also fell back this month
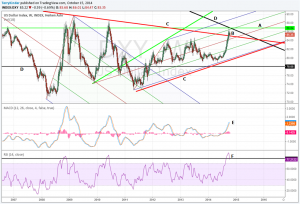
- A – Price resistance at $86.84. DXY price made it all the way up to $86.74 before falling back at B;
- C – Red triangle. DXY price exited out of the top of the triangle, but has since fallen back toward it;
- D – Large black triangle. Should King Dollar exit out of the top of this triangle price could go much higher. The more likely scenario is that price exits out of the bottom of the triangle and sets up for a re-test around $72.00;
- E – MACD still bullish, but could be getting ready to turn bearish;
- F – RSI still overbought but has fallen below the black horizontal line. At this point it seems pretty likely RSI will continue to fall until it is no longer overbought
Conclusion:
The Dollar has been in decline for many years. Whether you only look back to 1985 or all the way back to 1913, the dollar is in decline.
The recent dollar bullishness was largely overdone and it looks like its price is starting to move lower. The overall long-term trend of the declining dollar is also likely exerting its influence to push the dollar price down.
The weekly dollar chart looks relatively strong when compared to the daily chart, but does appear to be weakening.
Looking at the daily chart, the US Dollar price has folded like a cheap lawn chair, rapidly moving lower once it encountered the upper parallel channel of the Andrews’ Pitchfork.
Bullion.Directory or anyone involved with Bullion.Directory will not accept any liability for loss or damage as a result of reliance on the information including data, quotes, charts and buy/sell signals contained within this website. Please be fully informed regarding the risks and costs associated with trading in precious metals. Bullion.Directory advises you to always consult with a qualified and registered specialist advisor before investing in precious metals.


Leave a Reply