A look at the relationship between the United States Dollar and the price of gold
 Bullion.Directory precious metals analysis 10 September, 2014
By Terry Kinder
Investor, Technical Analyst

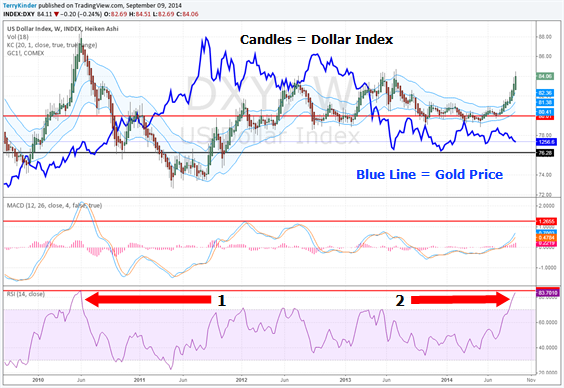
United States Dollar as represented by the DXY with gold price (COMEX gold continuous) overlay. Notice that when the United States Dollar price rises above $80.00, the gold price tends to fall. When the United States Dollar price falls below $80.00, the gold price tends to rise.
Key Features of the Chart:
1) Blue line is gold price as represented by Continuous COMEX gold contract. Highest price is a little over $1,900.00. Last price pictured on chart is a bit above $1,250.00;
2) Red/Green Heiken Ashi candlesticks are the price of the United States Dollar as represented by the Dollar Index (DXY). Price scale on right is for the DXY and not gold price;
3) Red line drawn through chart is drawn right around the $80.00 level;
4) Black line drawn underneath gold price, around $1,180.00, has provided pretty sold support dating back to July of 2010;
5) The three blue lines with lighter shaded blue in between them are Keltner Channels. The United States Dollar price has risen above the upper Keltner Channels indicating a strong price uptrend;
6) In the middle of chart is Moving Average Convergence/Divergence (MACD). MACD had a bullish crossover back in July. It could run a bit further. Whether or not it runs up to where the red line is drawn may depend on what the Relative Strength Index (RSI) drawn below it does;
7) Relative Strength Index (RSI), as shown by red arrows labeled 1 and 2, is nearing its highest overbought level, on a weekly basis, since 2010 when the United States Dollar peaked.
What Direction for the United States Dollar and Gold Price?
1) The last time the United States Dollar climbed as far above the Keltner Channels as it has now was back in 2010. When it did, it had 7 weeks where half or more of the green Heiken Ashi candle bodies were above the Keltner Channels. After that, the candles turned red and the price started to decline. This time there have been 4 weeks of green Heiken Ashi candles (if you count the candle from the week of 8-18-14) so far. So, if this run up is similar to the one in 2010, we could have up to another 3 weeks, after this week, for the United States Dollar price to go higher;
2) The United States Dollar price is well above the $80.00 level. Usually, when the United States Dollar price rises above $80.00 the gold price falls;
3) Gold price has fought to maintain support near $1,250.00 several times. If it fails to hold support at this level, it could slip back under $1,200.00, perhaps to the $1,175.00 to $1,185.00 level before finding further support.
Continued United States Dollar strength could potentially go on for 2-3 more weeks. If it does, there is a good chance the gold price will slip below $1,200.00 – perhaps testing support at the $1,175.00 – $1,185.00 level.
Bullion.Directory or anyone involved with Bullion.Directory will not accept any liability for loss or damage as a result of reliance on the information including data, quotes, charts and buy/sell signals contained within this website. Please be fully informed regarding the risks and costs associated with trading in precious metals. Bullion.Directory advises you to always consult with a qualified and registered specialist advisor before investing in precious metals.


 Material provided on the Bullion.Directory website is strictly for informational purposes only. The content is developed from sources believed to be providing accurate information. No information on this website is intended as investment, tax or legal advice and must not be relied upon as such. Please consult legal or tax professionals for specific information regarding your individual situation. Precious metals carry risk and investors requiring advice should always consult a properly qualified advisor. Bullion.Directory, it's staff or affiliates do not accept any liability for loss, damages, or loss of profit resulting from readers investment decisions.

Leave a Reply