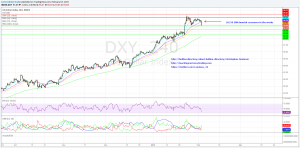
The US dollar has declined two percent since reaching 95.5 last week.
 Bullion.Directory precious metals analysis 3 February, 2015
By Christopher Lemieux
Senior Analyst at Bullion.Directory; Senior FX and Commodities Analyst at FX Analytics
The dollar index is extending losses, falling .60 percent on the day. The declines are a combination of factors. The intraday chart is suggesting further downside near-term.
The dollar has taken a hit as short-covering is taking place in crude. Pushing above $51 per barrel, West Texas Intermediate (WTI) is up almost three percent on the day. This is relatively healthy given the steep, dramatic decline seen over the last several months, but it is unknown whether or not the tide has turned.
The economic data out of the US, Europe and China have been weak. Manufacturing data is looking troublesome, too. The macro-picture still points to lower crude, while traders will periodically pile in on technical pick-ups.
As Fed President Bullard receives a fresh helping of egg on his face from his “the economy is showing a lot of momentum” comment earlier today, US data continues to disappoint.
US factory orders declined for a fifth month straight. According to the Commerce Department, new orders for finished goods fell 3.2 percent in December, following a 1.7 percent decline in November. Data showed the decline in demand to be broadly based across numerous industries. Yesterday, the ISM manufacturing data supported the decline in the manufacturing sector by hitting the perfect bearish tri-fecta: collapsing new orders, supported by declines in prices and employment.
Prices fell to levels not seen since 2009.
Another key data point that hit levels not seen since 2009 was personal spending, which contracted .3 percent from December’s .5 percent increase.
For an economy that is 70 percent based on consumption, spending is not where it needs to be in order to support the thesis of a “growing” economy with a lot of “momentum.”
The economic data sends a clear statement because the whole premise of the Fed increasing rates would be that data would have to continuously come in stronger than the month previous. When data continues to disappoint, the likelihood of the Fed fund rate diminishes, as broad expectations were moved from mid-2015 to early 2016. That is net-negative for the US dollar.
In regards to the intraday charts, the US dollar’s price action remains weak.
Technically, losses have caused the DXY to reach an “oversold” state, but momentum to the upside might be waning. The negative price action indicator (- DMI) has spiked higher, bringing the ADX higher with it. This could indicate more downside action is to come.
Initially, the dollar has support at 93.80, while a close below this would signal a target for 93.35. The 20-4H EMA is looking to bearishly converge with the 50-4H EMA, and this should accelerate the decline.
Keep an eye on the 72 EMA. It’s not a common moving average to follow, but it is a little trick I picked up during my time on the trading desk. Price action typically coinsides with this moving average, and a lot of institutional traders follow this closely. If the 72 EMA rolls over, price action will be taken with it.
Price action also looks with on the daily chart. The -/+ DMI is closing its divergence as the ADX is showing a loss in current trend momentum.
Bullion.Directory or anyone involved with Bullion.Directory will not accept any liability for loss or damage as a result of reliance on the information including data, quotes, charts and buy/sell signals contained within this website. Please be fully informed regarding the risks and costs associated with trading in precious metals. Bullion.Directory advises you to always consult with a qualified and registered specialist advisor before investing in precious metals.


 Material provided on the Bullion.Directory website is strictly for informational purposes only. The content is developed from sources believed to be providing accurate information. No information on this website is intended as investment, tax or legal advice and must not be relied upon as such. Please consult legal or tax professionals for specific information regarding your individual situation. Precious metals carry risk and investors requiring advice should always consult a properly qualified advisor. Bullion.Directory, it's staff or affiliates do not accept any liability for loss, damages, or loss of profit resulting from readers investment decisions.

Leave a Reply