

The spiral lower of the U.S. Dollar and the shape of snail shells are governed by universal mathematical laws
 Bullion.Directory precious metals analysis 3 February, 2015
By Terry Kinder
Investor, Technical Analyst
There has been a lot of talk within the gold community that the dollar’s move higher portends its ultimate collapse. On the other hand, there has been interesting speculation that perhaps the dollar is about to take a breather and move lower. However, rather than pose as a fortune teller or regale you with a charming, but opinion laced story of where the dollar price is headed, I created a chart instead.
While I realize the chart to follow below is a little busy and isn’t what most people are used to, I hope you’ll bear with me a moment, and take a look at the chart, because it is useful and based on universal principles of mathematics and proportion seen widely in the natural world.

Mathematical law governs prices and the shape of snail shells. Image: pixabay
The fib spiral is based on the golden mean 1.618, which is also related to the Fibonacci sequence you might commonly see if you have seen charts with Fibonacci Retracement Levels. The shape of the spiral is seen in things as diverse as the human ear to snail shells. Nature and the universe are logically constructed on mathematics and feature internal order. It is the adherence to universal law, order and mathematics that allows the better technical chart analysis tools to work. By using such tools, rather than depending on opinion and pleasant stories you’re essentially accepting rather than fighting the rules that guide how things work in the natural world.
Somewhat ironically, people today – in the midst of all of the technology available – are less aware than ever of the natural world and the mathematical laws that make things work. Every day we are flooded with “information” from diverse sources. Most of this so-called “information” hasn’t been fact checked by anyone. It is, in actuality, opinion disguised as analysis.

However, despite the diversity of opinion in the world, universal laws can’t be overridden. Our analysis must follow those laws rather than try to bend them to our will. I love a good story as well as the next person. In fact, regarding the dollar as of late, we have had at least a couple of stories circulating:
1) The U.S. Dollar price is going to the moon. It is unstoppable. A variant of this story is that the dollar is going to go ever higher right before it implodes and is replaced as the reserve currency;
2) The U.S. Dollar climb higher is over, at least for now. A variation of this story points out that the U.S. economy is extremely weak and implies the dollar will crash.
These narratives are a bit like the evening news (fact filled as the media outlets are), if you flip through enough channels, you’ll hit on a story teller you like better than all of the rest because they tell you exactly what you want to hear. I decided a long time ago that: 1) Fortune telling should be left to fortune tellers; 2) I don’t enjoy spinning yarns or tall tales, so; 3) I would rely on facts rather than opinions and follow where the numbers led me.
So, rather than wade through a knee-deep pool of dollar narratives, let’s take a look at our chart.
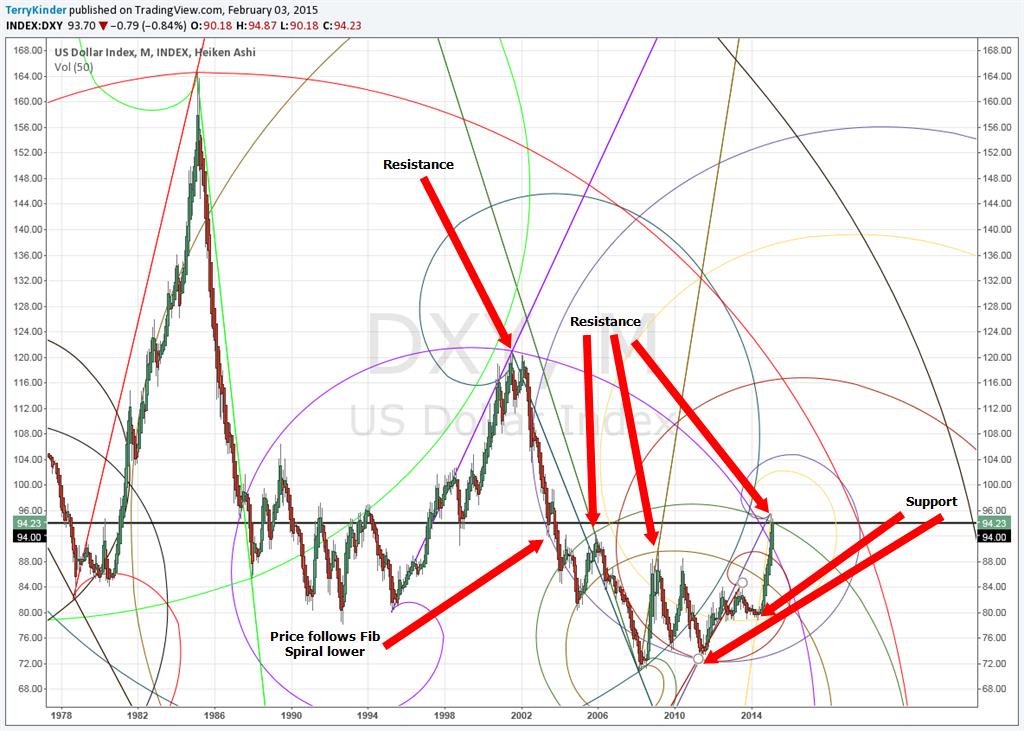
The chart is a bit overwhelming to look at initially, but it will make more sense in a moment. Essentially the chart is constructed of various Fibonacci (Fib) Spirals. These spirals are anchored on various pivot high and pivot low prices. The major high and low prices have been included, as well as some intermediate ones.
I have highlighted assorted support and resistance levels as dictated by the Fib Spirals. One area of resistance is around the $120.00 level as you can see by the purple spiral. Another area of resistance was between $88.00 and $90.00.
There is a large red arrow pointing to where price found strong support near $73.00 to $74.00 It’s important to note some of these spirals merely confirm support and resistance levels of the past while others show support and resistance levels in the future.
Perhaps the most significant feature of the entire chart if near where the dollar price is today. Near the $94.00 level, there is a green Fib Spiral. That spiral is based on the March 2008 U.S. Dollar Index (DXY) low of $70.69 and the November 2005 interim high of $92.63.
If you look at the chart carefully, should the dollar fail to break above the green Fib Spiral this month, there isn’t a lot of support below the current price. It would be pretty far into the $80’s before the dollar caught any support.
Alternatively, the dollar price could crawl down the Fib Spiral similarly to what it did in the early 2000’s.
Should the dollar manage to finally break higher, it faces resistance above $100.00 and again above $104.00. If you keep looking higher, you can see where the Fib Spirals will offer resistance.
Still not convinced that technical analysis can yield valuable information? Prefer the sweet Siren song of narrative? Let me give offer you one final and simple chart that confirms exactly where the dollar is in its cycle and why it has met with price resistance.
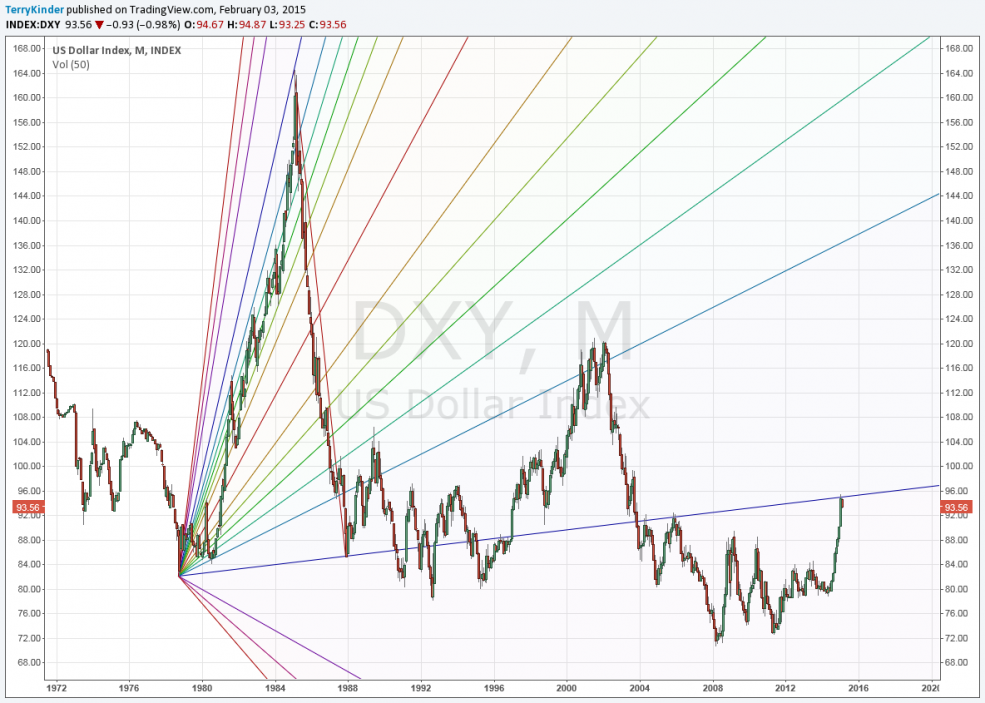
A picture is worth a thousand words of narrative.
The above chart is the dollar Pitchfan. It starts at the dollar pivot low of $82.07 in October of 1978. It marks the pivot high of $164.72 in February 1985 and the next pivot low of $85.33 in December of 1987. One thing you might notice right away, the line that runs from the October 1978 pivot low through the October 1987 pivot low provided support and / or offered resistance in each of the following decades:
1) 1970’s
2) 1980’s
3) 1990’s
4) 2000’s
5) 2010’s
Where the dollar price has currently stalled is right at that line. It’s the same point highlighted by our green Fib Spiral.
We don’t encounter resistance levels over and over again because of clever stories. Prices are based on the knowledge and preferences of millions of people and provide signals that others react to. These prices are governed by certain universal, mathematical laws. Prices don’t care one whit what story is being told about them or where you, I or anyone else thinks they should go to next.
Prices are governed by universal, mathematical laws. The sooner we stop listening to the Siren song of narrative and, instead, seek to understand the laws that govern prices, the sooner we can stop relying on opinion disguised as analysis and begin to gain more insight into the direction and momentum of price movements.
Bullion.Directory or anyone involved with Bullion.Directory will not accept any liability for loss or damage as a result of reliance on the information including data, quotes, charts and buy/sell signals contained within this website. Please be fully informed regarding the risks and costs associated with trading in precious metals. Bullion.Directory advises you to always consult with a qualified and registered specialist advisor before investing in precious metals.


