

Gold price “was supposed to” hold above $2k, but it looks ready to break below $1,900.
 Bullion.Directory precious metals analysis 23 June, 2023
By Przemysław K. Radomski
Founder of GoldPriceForecast.com
At what price can we see a turnaround? Let’s investigate gold’s chart to find out.
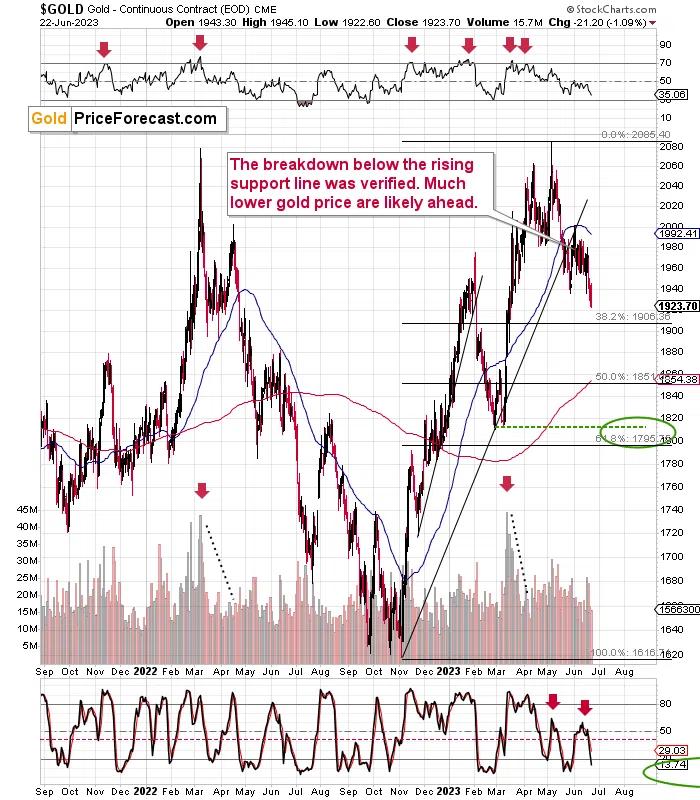

Overall, the key thing visible on the above chart is still the fact that the recent back-and-forth movement is one big verification of the breakdown below the rising, black support line.
And this is bearish. And as I wrote previously…
That was it.
No major rally.
No comeback above $2,000 (despite the attempt).
Just a regular verification of an important, short-term breakdown.
The implications are very bearish for the short term, especially when we factor in the similarity between now and the early-2022 performance.
Both declines started from very similar levels, and we first saw an initial slide that was then followed by a corrective upswing.
This time, the upswing was smaller, but that’s not surprising given support/resistance levels that were at play back and recently. Back in 2022, the 50-day moving average served as support, and this time we saw breakdowns below it and below the rising support line, and they were then both verified as resistance. This resistance limited the size of the corrective upswing.
Either way, the follow-up action is likely to be analogous, anyway. And this means that declines in gold are likely just ahead.
And it’s not just the breakdown below the rising support line we saw recently. Gold also moved below its May lows.
This implies that the post-breakdown consolidation is most likely over, and we’re about to see another very short-term slide.
That’s also in perfect tune with the sell signal from the Stochastic indicator that you can see in the bottom part of the above chart.
There was only one very similar signal in the recent past and it flashed in May – when gold formed its yearly top.
Needless to say, this is a very bearish analogy.
Now, the question is, how low can gold move before we see the next rebound?
The next support is provided by the 38.2% Fibonacci retracement level, but I don’t think it will trigger a significant rally. The reason is that it’s too close to the recent consolidation, and given the size of the preceding decline and the length of the consolidation, a bigger decline seems to be taking place.
The 50% Fibonacci retracement is the next candidate, and while it might provide support, it’s not very likely that it would. It’s not strengthened by anything more than the 200-day moving average, which – as you can see on the above chart – proved to be a poor support/resistance in the recent past.
The support provided by the 61.8% Fibonacci retracement is stronger as it’s close to the May lows as well as the psychologically important $1,800 level (it’s important as it’s round, which attracts attention). If gold goes to this level in a fast manner, it will be very likely to rebound in a meaningful manner.
It’s not as likely for the higher support levels.
The upcoming decline will likely create a great opportunity to take profits from the current short position in mining stocks and perhaps to switch to a long position in the GDXJ. This could happen as early as next week. There are no certainties in any market, but the above does seems quite likely.
Whether we do indeed see this great opportunity will depend on the way miners get to their downside target.
Przemyslaw Radomski


Przemyslaw K. Radomski, CFA, has over twenty years of expertise in precious metals. Treating self-growth and conscious capitalism as core principles, he is the founder of GoldPriceForecast.com
As a CFA charterholder, he shares the highest standards for professional excellence and ethics for the ultimate benefit of society and believes that the greatest potential is currently in the precious metals sector. For that reason it is his main point of interest to help you make the most of that potential.
This article was originally published here
Bullion.Directory or anyone involved with Bullion.Directory will not accept any liability for loss or damage as a result of reliance on the information including data, quotes, charts and buy/sell signals contained within this website. Please be fully informed regarding the risks and costs associated with trading in precious metals. Bullion.Directory advises you to always consult with a qualified and registered specialist advisor before investing in precious metals.


Leave a Reply