

Gold price held up well yesterday. But will it be able to handle the USD Index’s breakout?
 Bullion.Directory precious metals analysis 19 March, 2023
By Przemysław K. Radomski
Founder of GoldPriceForecast.com
The yellow metal moved back to the Dec. 2023 high and bounced from it, and today, it just did the same thing.
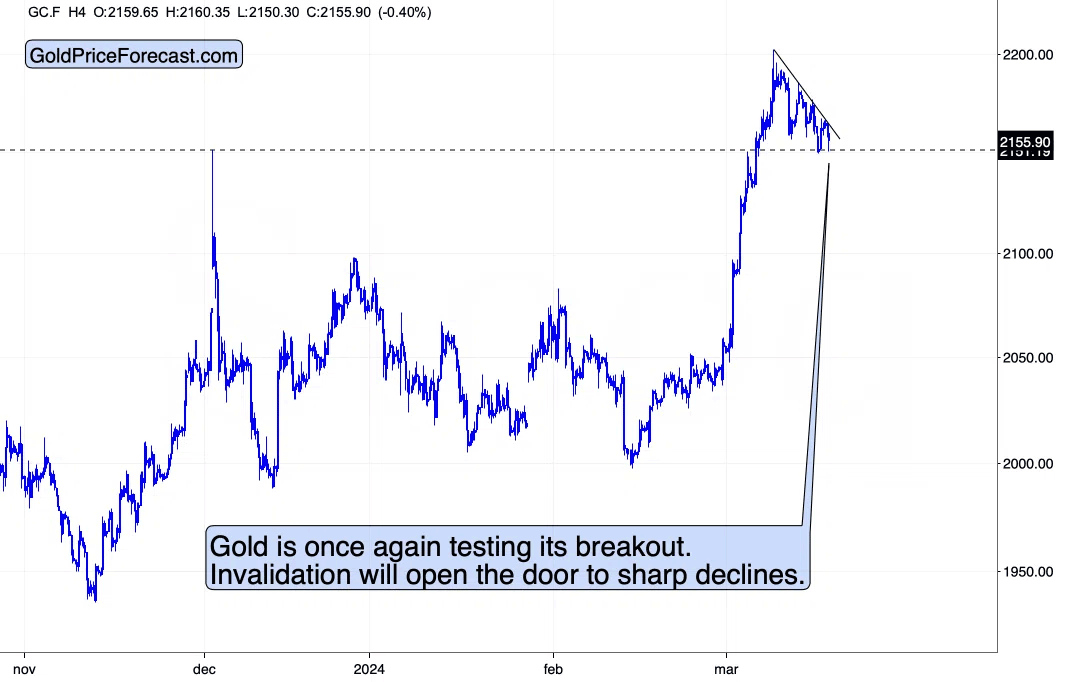

Yesterday’s price action looked quite promising, as the verification of the breakout would indeed be a bullish thing. Still, with lower highs, gold’s breakout might get invalidated any hour now. Here’s why:

In yesterday’s analysis, I wrote:
All those moves appear to have created a flag pattern, which is a “continuation pattern”. Once the USD Index moves above its recent highs, it’s then likely to rally once again.
The price moves that tend to follow flag patterns are usually similar to the ones that preceded those patterns. In this case, that would imply a rally to about 103.8. This, in turn, would be likely to trigger visible declines in gold – and an invalidation of the rally above the 2023 high.
The rally in the USD Index materialized, however, gold has not slid profoundly just yet. This might be a bullish indication, but…

Since the USD Index just broke above its declining resistance line, another wave up became likely.
While the rally that we saw recently wasn’t enough to trigger gold’s invalidation, the next move up in the USDX would be likely to do the trick.
The next short-term target for the USDX would be in the 104.1 – 104.2 range.
In the case of gold, once it invalidates the breakout, it’s likely to then slide back down with vengeance – catching up on its reaction to the USD Index’s rally.
Remember about the mega-top theory? This could be the moment in which all (or most) markets top and people get back to appreciating cash – U.S. dollar. Here’s how one of its alternatives – bitcoin – is currently invalidating its breakout.

The move below the 2021 top was subtle at first, but now it’s not subtle anymore. It’s crystal-clear, and the implications are very bearish.

The stock market has been trading sideways in recent days, but given the fact that it’s been doing so after breaking below the rising support line and then failing to move back above it, the implications are bearish here as well.
The same goes for the shape of yesterday’s session – it was a daily reversal.
The Chinese stock market might be topping here as well.

The RSI based on the Shanghai Stock Exchange Index moved above 50 after touching 30, which previously (in 2022 and 2023) meant that the correction had already run its course. In 2022, the correction ended when the index moved to its 50-week moving average, which is also where the index is (approximately) right now.

Meanwhile, the GDXJ declined by over 1% yesterday, even though GLD was up by 0.16%. This relative weakness of mining stocks suggests that we’re on the verge of a breakdown.
The tiny breakdown below the rising, dashed, blue support line suggests the same thing.
Plus, the analogy to late-2023 remains intact, and so do my comments on it:
The GDXJ moved above its 61.8% Fibonacci retracement one more time, and it even moved above the mid-January highs. It already invalidated the breakout above those highs TWICE, and it’s now it’s trying to break higher for the third time.
The invalidations were sell signs, and they make the current attempt to move higher really doubtful.
(…)
The most bearish thing about this week’s price moves is that they are very similar to what we saw at the late-2023 top.
The previous big short-term rally ended when the GDXJ moved a bit above the previous highs and then formed a double-top pattern. This is exactly what we see right now.
How can something that preceded an almost $10 decline in the GDXJ be something bullish?
This time, we saw a third small move to the January highs, and it too was followed by declines. Why did we saw three small tops this time and not two? Because the history rhymes – it doesn’t repeat itself to the letter.
The important thing is that overall the GDXJ moves above and below the previous highs and the upward momentum is gone.
This is exactly what triggered big declines in the past, and what’s likely preceding them now.
Przemyslaw Radomski


Przemyslaw K. Radomski, CFA, has over twenty years of expertise in precious metals. Treating self-growth and conscious capitalism as core principles, he is the founder of GoldPriceForecast.com
As a CFA charterholder, he shares the highest standards for professional excellence and ethics for the ultimate benefit of society and believes that the greatest potential is currently in the precious metals sector. For that reason it is his main point of interest to help you make the most of that potential.
This article was originally published here
Bullion.Directory or anyone involved with Bullion.Directory will not accept any liability for loss or damage as a result of reliance on the information including data, quotes, charts and buy/sell signals contained within this website. Please be fully informed regarding the risks and costs associated with trading in precious metals. Bullion.Directory advises you to always consult with a qualified and registered specialist advisor before investing in precious metals.


Leave a Reply