

What COMEX gold and the GDX ETF can tell us about physical gold prices
 Bullion.Directory precious metals analysis 8 September, 2014
By Terry Kinder
Investor, Technical Analyst
What is “Paper Gold“? The term paper gold means you have a piece of paper acting as a substitute for the physical gold. With paper gold, you don’t own the gold; you own a promise to receive physical gold. In plain English, it means you are a creditor of the corporation issuing the paper gold certificate, thus subject to counterparty risks. Owning the physical gold has no counterparty risk and is fully under your control.
Examples of paper gold are gold certificates issued by banks and mints, pool accounts, futures accounts and the NYSE listed exchange-traded fund. With these products you own a piece of paper rather than physical gold. These paper products give you exposure to the gold price; you can make a profit by selling them to someone wishing to own paper gold, however when the music stops and nobody wants to purchase paper anymore, it becomes worthless since you may not able to redeem your metal.

Bullion dealers often hedge their inventory via futures contracts on the COMEX in order to protect themselves from losses should the price of gold drop. Like it or not, the spot price you pay for gold will move up or down based on the paper price of gold on the COMEX. For that reason, if nothing else, it is worth having some idea of the relationship between the gold mining ETF GDX, COMEX gold price and the spot, or physical, price of gold.
So, how does the GDX relate to the price of COMEX gold? Looking at the chart below, you will see three red arrows pointing to where the price of GDX crossed either over or under the price of COMEX gold. Saying the GDX price crosses the COMEX gold price doesn’t mean at an equal price level. It means that when we overlay the prices, that the prices cross. When GDX crossed under the COMEX gold price, then the COMEX gold price tended to move down. When the GDX price crossed above the COMEX gold price, then the COMEX gold price tended to move up. This would seem to make sense as the health of the mining sector is affected by the gold price, and the gold price is affected (but perhaps not as much as you might think, since there is an enormous supply above ground) by the amount of gold mined.
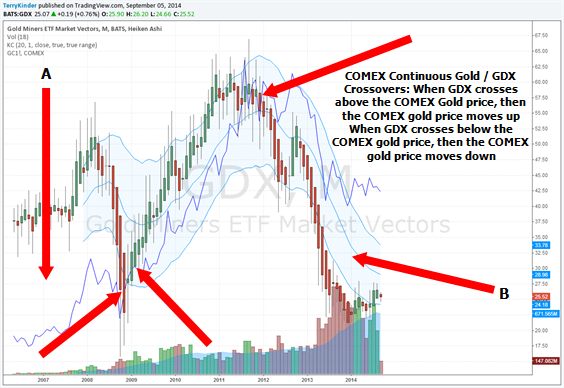
GDX-Continuous COMEX Gold Crossovers: When GDX crosses above COMEX gold price, COMEX gold price tends to follow it higher. When GDX crosses below COMEX gold, COMEX gold tends to follow it lower. Notice also the two large gaps labeled A and B. The first gap closed taking COMEX gold higher. Will the gap labeled B result in COMEX gold price moving lower?
While you would think that the COMEX gold price and the GDX price would track each other closely, that isn’t always the case. Look at the red arrows labeled A and B in the chart above. In the gap labeled A the GDX is valued relatively higher when compared to COMEX gold. The reverse is true in the gap labeled B – COMEX gold is valued relatively higher when compared to the GDX. In the earlier gap the GDX price fell back toward the COMEX gold price, reducing the gap before the price of both began to rise again. This leads to the question, will the opposite happen with the current gap? Will the COMEX gold price fall to close the gap with the GDX price? If so, will the COMEX gold price and GDX continue up or down afterwards?
The GDX chart below featuring the Hilbert Transform Sine Wave can help answer the question of which way the GDX and COMEX gold prices will move. The Hilbert Transform Sine Wave has some unique characteristics than can help in our price analysis:
In this way, the Hilbert Sine Wave combines the best characteristics of an oscillator -signaling over-sold and over-bought in a cyclical range – as well as the best characteristics of a moving average – signaling the start and end of a trending move.
Hilbert Sine Wave – Don’t Trade Cycles Without It! (Note: If you click on the link you will download an Adobe PDF file)
When the Hilbert Transform Sine Wave bottoms this indicates that the price has topped. As the sine wave moves up, the price moves down. As long as the dashed red line and red line don’t cross, the price trend will continue in the same direction. When the red line and dashed red line cross, that indicates a change in trend. When the sine wave makes a top this indicates that the price has bottomed. On the chart below notice red arrows labeled A and B. A points to where the sine wave bottomed, which corresponds to where the price topped at B. Since then, the price has been moving down. Until the dashed red line and red line cross, we should expect price to generally move down.
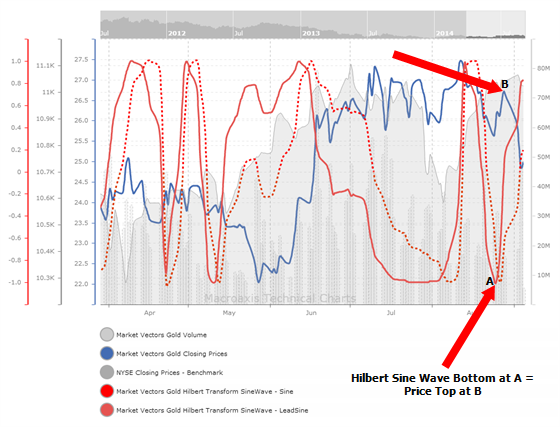
The downward price momentum in GDX looks to continue, at least for a while, as seen by the Hilbert Transform Sine Wave
In the GDX chart below MAMA – the Mesa Adaptive Moving Average – has made a bearish crossover, indicating price is heading down. The Chaikin A/D Oscillator, and Moving Average Convergence/Divergence (MACD) are both below the zero line which is bearish. Relative Strength Index (RSI) is approaching, but has not yet crossed into oversold territory.
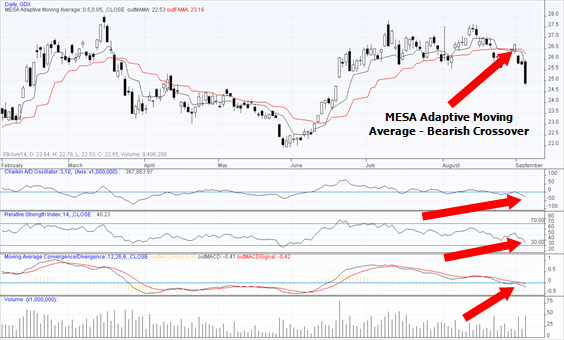
GDX chart is looking bearish with MESA Adaptive Moving Average bearish crossover, MACD crossing below the zero line and the Chaikin A/D Oscillator also crossing below the zero line.
If GDX still has room for price to move down, what about COMEX gold? The short answer is, yes. In the weekly continuous COMEX gold chart below you can see price is approaching the bottom of the Keltner Channels. Price recently has largely stayed within the Keltner Channels, which indicates mostly sideways price action. Should the price drop below the channels that would mean price is strongly trending down. If the price rises above the channels, then a strong price uptrend would be in place.
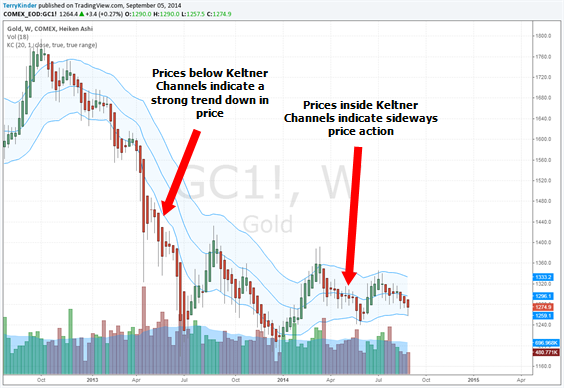
Current price action of the weekly COMEX Continuous Gold has been within the Keltner Channels, which signifies largely sideways movement. When price falls below the Keltner Channels, this indicates a strong price trend down. The opposite is true if price rises above the bands.
Switching back to the weekly GDX chart – the red Heiken Ashi candlesticks indicate a price downtrend. Price has been unable to hold near the top of the Keltner Channels, and it looks like it could drift back down to around $24.01 or, perhaps, lower.
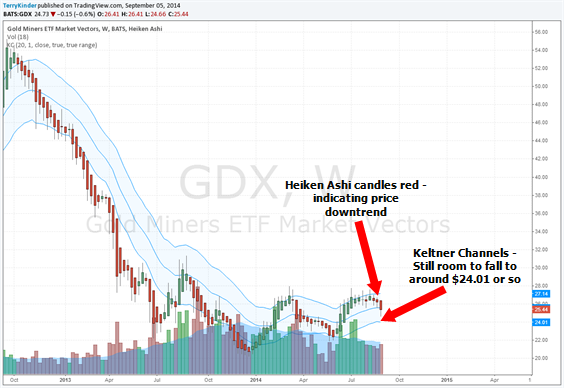
Heiken Ashi candles on GDX chart are red, indicating downward price momentum. Keltner Channels show price could move down to around $24.01 or so.
The final chart is the monthly GDX. It appears that prices have rebounded off the lows and that the Keltner Channels may be straightening somewhat. The $24.17 price level at the bottom of the Keltner Channels coincides pretty nicely with the $24.01 level on the weekly GDX. While the bottom of the Keltner Channels doesn’t imply support, it is an interesting coincidence that the bottom of both channels is fairly close in price. Given that the monthly GDX prices can have very big spikes, both up and down in price, it wouldn’t be surprising to see a big move in either direction temporarily as we get a better idea of how the price trend will play out.
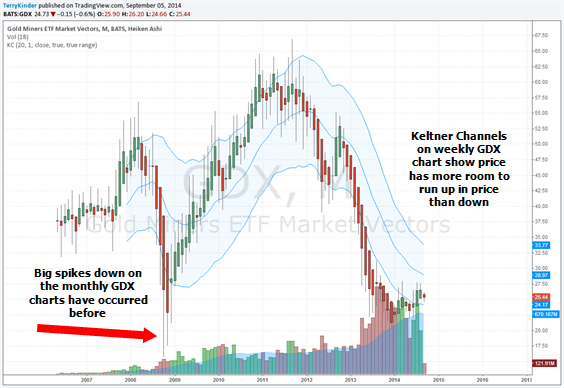
The Keltner Channels on the monthly chart of GDX show price has more room to run up than down, but beware of the potential for nasty price spikes to the downside.
Conclusion
The price of COMEX gold, the GDX and physical gold are related. Some may not like that the paper GDX ETF and COMEX gold prices influence the physical gold price, but they do. When the GDX price crosses below the COMEX gold price, then the COMEX gold price moves down. When the GDX price crosses above the COMEX gold price, then the opposite is true. Saying the GDX price crosses the COMEX gold price doesn’t mean at an equal price level. It means that when we overlay the prices as we did in the first graph in the article, that prices cross. At times the GDX and COMEX gold prices track each other closely. At times a gap forms between them. Currently, there is a pretty large gap between the prices. We should expect that the gap will close down. Given the chart pattern, it seems likely that the COMEX gold price will need to move down some to meet the GDX price. There is room for the COMEX gold price to move down on the weekly, monthly and daily charts (daily and monthly charts not shown in this article). RSI is not oversold for COMEX gold on the daily, weekly or monthly charts, although it is getting nearer the oversold level on the daily chart.
Expect COMEX gold and GDX prices to drift lower for a bit longer, taking the price of physical gold with it.
Bonus Thought for the Week:
If your work isn’t what you love, then something isn’t right.
Talking Heads – Found a Job
Bullion.Directory or anyone involved with Bullion.Directory will not accept any liability for loss or damage as a result of reliance on the information including data, quotes, charts and buy/sell signals contained within this website. Please be fully informed regarding the risks and costs associated with trading in precious metals. Bullion.Directory advises you to always consult with a qualified and registered specialist advisor before investing in precious metals.


Leave a Reply