…But Investors ‘Uninterested’ as SLV Grows Again
 Bullion.Directory precious metals analysis 12 July, 2017
By Adrian Ash
Head of Research at Bullion Vault
Asian and European stock markets flipped yesterday’s action to fall and rise respectively, while bond prices and commodities also rose.
Silver rose to touch $16 per ounce for the first time since last Friday’s “fat finger” crash on Comex derivatives exchange prices.
Yesterday’s drop in silver prices to April 2016 lows saw investors again buy shares in the iShares Silver Trust (NYSEArca:SLV), taking the ETF’s bullion backing up to a new 8-month high at 10,793 tonnes.
That’s equal to 39% of last year’s global silver mining output according to data from specialist analysts Metals Focus.
Shareholdings in the giant GLD gold ETF meantime stayed unchanged at Monday’s 3.5-month low, needing 832 tonnes of bullion backing – equal to 26% of 2016 global mine output.
“Investor disinterest in gold and the implied expression of trust in the sustainability of current economic arrangements bewilders us,” writes US fund manager John Hathaway in his latest quarterly letter for clients of Tocqueville Asset Management.
“A hard look at the facts suggests that a return to the normality of the past is unattainable, and that the captains of economic policy are living in a dream world.
“Even small exposure to [gold bullion] would be the financial-asset analog of fire insurance on one’s home. We therefore recommend taking advantage of periodic pullbacks…to initiate or expand positions.”
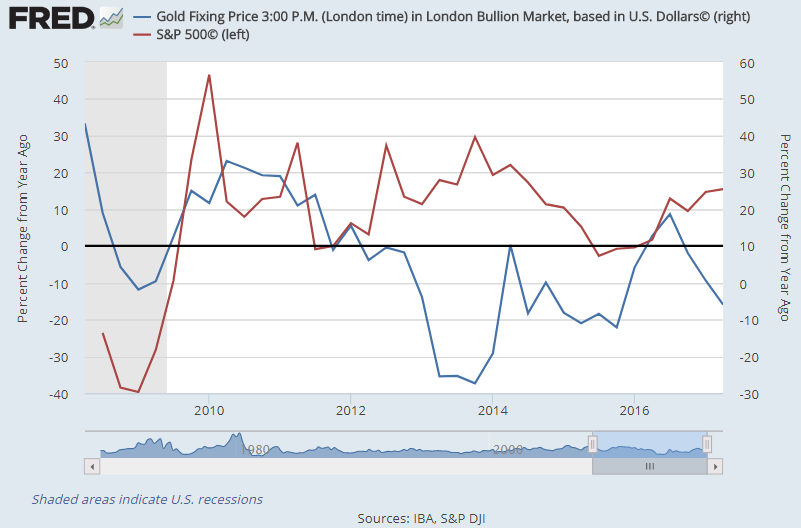
Data in fact show gold and the US stock market moving in the same direction slightly more often than opposite over the last decade, with the two assets either rising or falling together 57% of the time from 12 months earlier on a quarterly basis.
“We think gold may trade sideways for now, holding above $1200 but not garnering enough buying interest to break decisively higher,” reckons James Steel, analyst at global retail, investment and bullion bank HSBC.he says.
“Physical demand in some important emerging market consumer nations also appears to be positive, notably India, and oil prices, if they stabilise, could help steady gold.”
Looking at the last month’s collapse in Comex gold futures and options speculation however, “Long positions have been cut and leave the market open to a short covering rally,” Steel adds.
The last 4 weeks of speculative selling on Comex mean “much of the potential long liquidation has already occurred” agrees Swiss bank and HSBC’s fellow London bullion clearer UBS in a note.
Bullion.Directory or anyone involved with Bullion.Directory will not accept any liability for loss or damage as a result of reliance on the information including data, quotes, charts and buy/sell signals contained within this website. Please be fully informed regarding the risks and costs associated with trading in precious metals. Bullion.Directory advises you to always consult with a qualified and registered specialist advisor before investing in precious metals.


 Material provided on the Bullion.Directory website is strictly for informational purposes only. The content is developed from sources believed to be providing accurate information. No information on this website is intended as investment, tax or legal advice and must not be relied upon as such. Please consult legal or tax professionals for specific information regarding your individual situation. Precious metals carry risk and investors requiring advice should always consult a properly qualified advisor. Bullion.Directory, it's staff or affiliates do not accept any liability for loss, damages, or loss of profit resulting from readers investment decisions.

Leave a Reply