

I’m not here to tell you what to think (honest)
 Bullion.Directory precious metals analysis 28 January, 2015
By Terry Kinder
Investor, Technical Analyst
I’m not here to tell anyone what they should think about gold. I would like to help you develop your own methods to think about gold and gold charts. I hold gold and will likely hold some for the foreseeable future. Over the years I have been bullish and bearish. In some ways technical analysis is a bit like meditation, it requires you to empty your mind. Image: pixabay
As a technical analyst it’s my job to make my best effort at teasing out what stories the numbers, prices, chart patterns, technical indicators, etc. are telling. To do that, it requires me to put my own beliefs and other notions aside and simply look at what things such as price and volume are saying. In some ways technical analysis is a bit like meditation, it requires you to empty your mind. It’s a paradox – in order to obtain a fuller understanding, you have to become empty.
Let’s try a small exercise. Try and look at the following chart as if it was a chart of the wheat price.

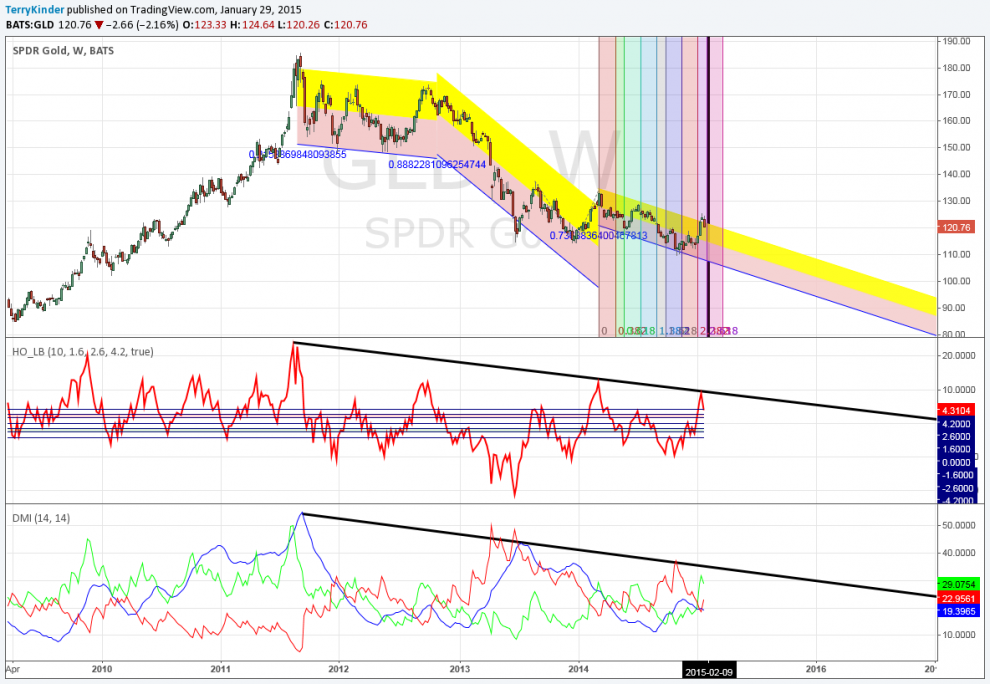
If this were a chart of wheat would you buy it believing the price would go up?
If the above chart was a chart of wheat, would you buy it? Would you expect the price to go higher soon? Would you short it, expecting the price to drop? I’m not going to give you any answer. Does it make a difference that the chart is of the GLD ETF? What if this were a chart of the spot price of gold? Does it matter at all to you?
Maybe it does or maybe it doesn’t and that is fine. The point of our little exercise is to try and look at the price objectively. Whether I own gold or don’t shouldn’t influence how I view the chart. A chart is a chart to a technical analyst. If a technical analyst changes his or her analysis depending on what commodity, stock, etc. is charted, then how can we trust that analyst’s analysis?
So, we’re back to emptying our minds, putting to one side preconceptions and doing our best to see price as it is – nothing more and nothing less.
Bias is tricky. I touched on it in a previous article, quoting Stephen Covey:
If the ladder is not leaning against the right wall, every step we take just gets us to the wrong place faster.
Our analysis of price doesn’t do us much good if we pick an incorrect point with which to begin. Far too often I see many different technical analysts start analyzing price and drawing long-term conclusions based on a price in the middle of a larger trend. Other times the analyst will look at a short-term or medium-term piece of a chart and draw a long-term conclusion. I’m not sure how they can do that. It would be a little like me standing in the middle of a street I had never been on and then telling you what was around the next corner.
Now, let’s say I walk the street and check out the neighborhood. Better yet, I charter a small plane and we fly around to get a lay of the land. With that, I have an overview. It still doesn’t make me psychic or give me the ability to see through walls or around corners, but I at least have a wider view of what surrounds the street.
Taking the big picture view and looking at the long-term price movement is similar to walking the neighborhood and then chartering the plane and getting a better lay of the land. After doing that you have a better feel for the contours of the land, the layout of the streets, what kinds of houses are there and any natural impediments to movement.
A price chart does much the same thing. By taking the longer-term view, you get a sense of where price has been and where it might be headed. You see certain price levels, both up and down, act as impediments to price movement. Unlike our imaginary neighborhood though, with prices we can only see so far before there is literally nothing left to see. No one can see tomorrow’s price, although there are a number of good tools that can help us bracket prices, seeing where natural support and resistance levels are.
Here’s another gold chart which appeared in the article mentioned previously:
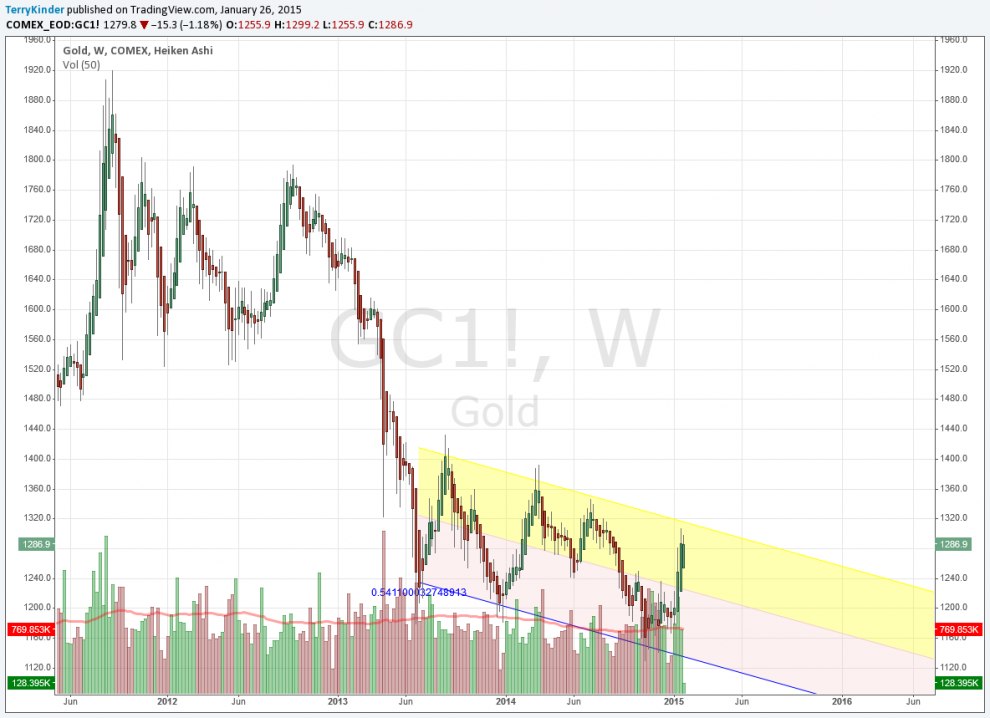
The gold price is in a descending price channel.
What do you see? Where does your eye naturally move to? Your eyes are keen instruments. However, we don’t always see what is in front of us. Sometimes we even see things that aren’t there at all. For example, on a long drive I once started hallucinating that there were animals in the middle of the highway. There were none. Did my eyes deceive me or did my tired brain misinterpret the data provided by my eyes?
If this article seems strange to you, let me try and explain it to you. When I was in high school, I had some excellent teachers. One of my favorite classes was a Humanities class taught by Mr. Hottell and Mr. Kistner. They were both very intelligent teachers. I especially enjoyed Mr. Hottell for his lively stories and great knowledge of history. He interspersed many anecdotes while teaching as he had traveled around the world. One time Mr. Hottell even sent me a postcard from Timbuktu (yes, it exists). Sometimes he would show us slide shows to supplement the classroom lecture, making it less dry and more real.

I hope to be able to, over time, teach you to interpret the charts for yourself. Image: pixabay
One of the main objectives of the Humanities class was to teach us to think for ourselves. While the teachers had their biases, they wanted us to be able to formulate, express and defend our own views. It wasn’t important, for instance, if I wrote a paper that the teachers thoroughly disagreed with, as long as I backed up my arguments with facts. It was okay to disagree. One of the most difficult exercises for me in the class was having papers read and critiqued by others. It wasn’t something, at least initially, that I enjoyed. However, over time, I came to enjoy it and value the opportunity to hear different points of view and learn of any errors in what I had written. The exercise made my writing better and allowed me to grow as a critical thinker.
Another important experience in my development was time spent in the U.S. Army. The military offers some of the best training on leadership available anywhere in the world. Their training for non-commissioned officers (NCOs) is excellent. One of the important philosophies the military teaches is that you should always be training your replacement. Whatever group you are put in charge of should, if necessary, be able to function without you. After all, in war, leaders are incapacitated, or even die in combat. It’s not pleasant to think about, but it’s reality.
A good NCO or officer is always looking to teach the people they command new skills so the team functions better. They are aware they won’t always be there and want their soldiers to be able to take action independent of them if necessary. They do their best to share what they know, explain the team’s objectives, and define any rules that should be followed by the team in making decisions.
My hope is, over time, to provide tools so you – the reader – don’t need me anymore. Don’t tell my boss though, he wants you to come back here and keep reading articles. Regardless, my objective is to help you to understand not only the benefits of technical analysis, but be able to look at a chart on your own and evaluate it. A chart contains a good deal of important information that you can use to make better decisions, whether to help decide when to buy precious metals, ETFs, stocks or whatever else.
We all have biases and blind spots. Technical analysis can help us become aware of what those biases are. It can make us aware of our blind spots.
While technical analysis won’t make you all-seeing or all-knowing, it will give you a better understanding of how the world of prices that surrounds you every day works.
It can also help you know the best time to buy or sell anything from commodities to stocks and more.
Who knows, you might even make your precious metals stack a little bigger by buying at the best possible price.
Bullion.Directory or anyone involved with Bullion.Directory will not accept any liability for loss or damage as a result of reliance on the information including data, quotes, charts and buy/sell signals contained within this website. Please be fully informed regarding the risks and costs associated with trading in precious metals. Bullion.Directory advises you to always consult with a qualified and registered specialist advisor before investing in precious metals.


Leave a Reply