The gold price is nearing a critical red line. How near is it? Read on to find out.
 Bullion.Directory precious metals analysis 12 March, 2015
By Terry Kinder
Investor, Technical Analyst
The gold price last week fell through several key levels including $1,208.00, $1,191.00 and $1,174.00. This week it fell below another critical level – $1,157.00. The next critical level is $1,140.00 which is dangerously close to the $1,130.40 low reached back in November of 2014. However, if the gold price continues to slip here it may prove more troublesome now than it did late last year.
Gold’s Red Line
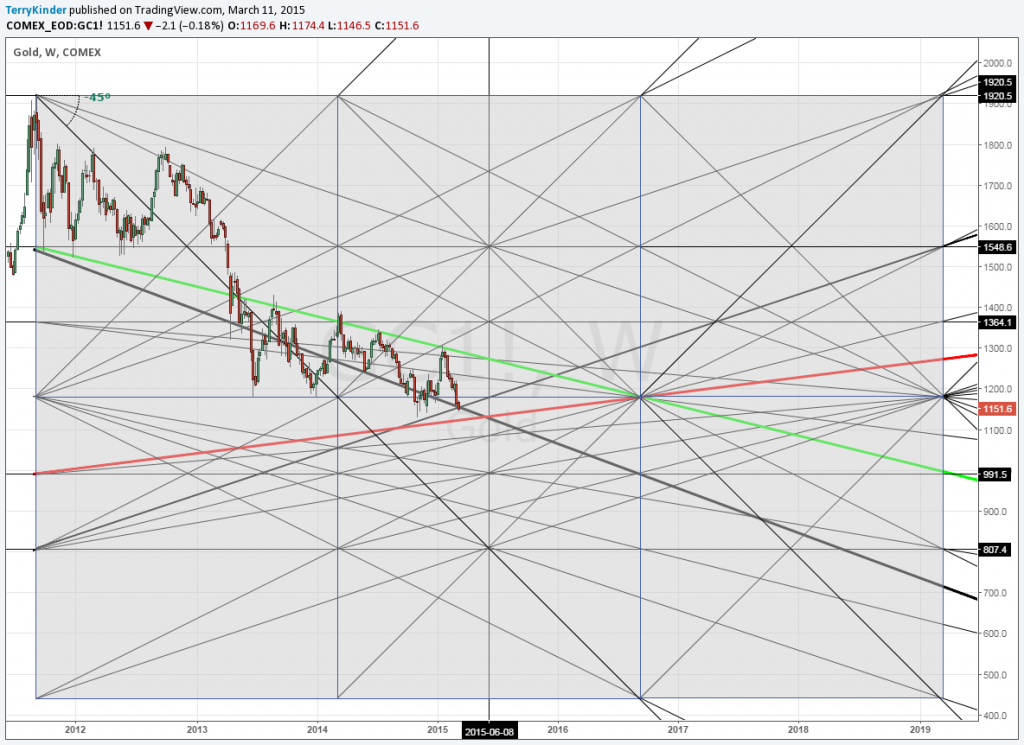
There are quite a few lines on the chart below, but the most critical ones are the green, red, thick bold black and thinner bold black lines.
The gold price currently rests where two critical support levels cross – one an upward sloping thinner black bold line and the other a thick black bold line, which has acted as support for the gold price for most of 2014 as well as this year.
The price of gold is actually below the point where the two black lines, highlighted above, cross. Should the yellow metal close the week below the intersection of those two lines, it may portend a further descent of the price towards the red line.
So, you may be wondering, what’s so critical about the red line? It’s largely a matter of geometry. The whole chart above is drawn based on a 45 degree descending line from the $1,920.80 all-time nominal high gold price. Should the price fall below the red line, it would signify the following:
- The gold price has fallen below support going back to 2011 – however, it wouldn’t be the first time this has happened;
- It would cement the idea that gold has moved from an upper square to a lower one. Should this occur, it implies $1,180.10 becomes the new price resistance level, rather than some level above $1,200.00;
- Owing to the geometry of prices, 45 degree lines tend to act as support and resistance. This creates the possibility that the gold price won’t have any support to catch it until $991.50 – where a line has been drawn through the top quarter of the bottom set of squares;
- The next 45 degree lines don’t come into play until an unmentionable level, but follow along to where the 45 degree lines cross on the lower middle square and you’ll see what I’m talking about.
Now, having said all of the above, that doesn’t necessarily mean that those price levels mentioned will come to pass. The gold price could bounce either near the current support lines, the red line, or any of the other support lines.
There isn’t anything that says the gold price won’t simply meander between for green and red lines for some period of time either.
However, my suspicion is that, unless the gold price manages to move up smartly above $1,157.00 and then make an effort to re-take $1,174.00, we are looking at the $1,130.40 level from last year being challenged and potentially violated to the downside.
Should $1,130.40 be violated, then $1,123.00 will become a very critical price level, and the last obstacle before the red line.
Bottom line – the gold price is facing a potential re-test of the $1,130.40 low from late last year. Barring a price reversal taking gold through $1,157.00 and, preferably $1,174.00, we may be looking at a new lower low and then a test of the critical red line.
Bullion.Directory or anyone involved with Bullion.Directory will not accept any liability for loss or damage as a result of reliance on the information including data, quotes, charts and buy/sell signals contained within this website. Please be fully informed regarding the risks and costs associated with trading in precious metals. Bullion.Directory advises you to always consult with a qualified and registered specialist advisor before investing in precious metals.


 Material provided on the Bullion.Directory website is strictly for informational purposes only. The content is developed from sources believed to be providing accurate information. No information on this website is intended as investment, tax or legal advice and must not be relied upon as such. Please consult legal or tax professionals for specific information regarding your individual situation. Precious metals carry risk and investors requiring advice should always consult a properly qualified advisor. Bullion.Directory, it's staff or affiliates do not accept any liability for loss, damages, or loss of profit resulting from readers investment decisions.
