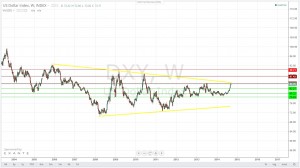
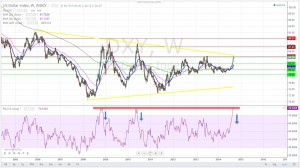
The US dollar index is boding against long-term, weekly resistance. As the FOMC minutes loom, it’s put up or shut up.
 Bullion.Directory precious metals analysis 16 September, 2014
By Christopher Lemieux
Senior FX and Commodities Analyst at FX Analytics
The US dollar is on a tear. The hype surrounding a potential rate hike by the Federal Reserve has pushed the dollar to the longest winning streak in 17 years.
The US dollar index (DXY) is finding resistance on the longer-term weekly chart. A descending resistance trend, which first began in November 2005, has kept the US dollar relatively in check. This descending trend is supporting the current price action resistance of 84.25. Ever since the financial markets became hysterical over a tightening of monetary policy and easy money, the dollar has notoriously pushed higher leading into an FOMC statement, and then it seems to come back to reality.
Will this time be different? Probably not. Higher interest rates will come eventually, but it is more likely that the Fed will not push itself into a corner tomorrow with a some sort of timeline. Fed Chair Janet Yellen will likely spin the current situation as the economy continues to grow, yet it is still in need of highly accommodating policies.
The labor market has been a critical guideline for the Fed. Currently at 6.1 percent, the US unemployment rate is at levels not seen since before the recession. However, that is largely due to a mix of a changing age demographic and the lowest labor participation rate since the late ’70s. And last month’s non-farm payrolls was less-than-desired, snapping a seven-month streak of 200,000+ jobs added. Only 142,000 jobs were added, and that was 40 percent lower than the general consensus.
If Yellen looks to guide the markets tomorrow by saying much of the same, the US dollar will pullback. Look for a sizable pullback to 82.25/50. Conversely, if the ultra-dove is feeling a little hawkish, the dollar will have to convincingly break through the descending trend at 84.50, which could lead its way higher. Unlikely, though.
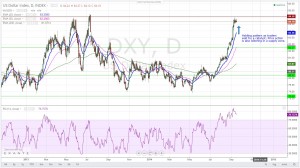
The daily chart is in a holding pattern, with both near- and longer-term charts all in overbought territory:
Bullion.Directory or anyone involved with Bullion.Directory will not accept any liability for loss or damage as a result of reliance on the information including data, quotes, charts and buy/sell signals contained within this website. Please be fully informed regarding the risks and costs associated with trading in precious metals. Bullion.Directory advises you to always consult with a qualified and registered specialist advisor before investing in precious metals.


 Material provided on the Bullion.Directory website is strictly for informational purposes only. The content is developed from sources believed to be providing accurate information. No information on this website is intended as investment, tax or legal advice and must not be relied upon as such. Please consult legal or tax professionals for specific information regarding your individual situation. Precious metals carry risk and investors requiring advice should always consult a properly qualified advisor. Bullion.Directory, it's staff or affiliates do not accept any liability for loss, damages, or loss of profit resulting from readers investment decisions.

Leave a Reply