Gold and silver markets enter the week with an opportunity to build on last Friday’s strong reversal.
 Bullion.Directory precious metals analysis 5 October, 2015
By Stefan Gleason
President of Money Metals Exchange
The metals had drifted lower through Thursday’s close, but they got a big boost Friday after the Labor Department released disappointing jobs numbers.
Even though the official unemployment rate held steady at 5.1%, the number of jobs added in September fell short of analyst expectations. Worse, a record 94.6 million Americans of working age now aren’t working. Most of these jobless Americans don’t get counted as “unemployed” – making the unemployment rate a dubious statistic.
It’s so obviously unrepresentative of real-world realities that even mainstream financial reporters are catching on.
Silver surged more than 5% on Friday to finish the week in positive territory and rallied another 2% on “Monday”. Gold trimmed its earlier losses.
The precious metal with the real price momentum right now, though, is palladium – coming in on a four-week winning streak.
Silver Prices Winding Up for Potential Breakout
The metal with the most momentum in terms of investor interest is silver. Silver bullion demand in the third quarter exploded, with sales of Silver Eagles hitting a record 14.3 million ounces.
That number would have been even bigger if the dysfunctional U.S. Mint hadn’t arbitrarily limited supplies of coins going out to dealers. The market for physical silver remains tight, with supplies of most bullion products in short supply and premiums elevated.
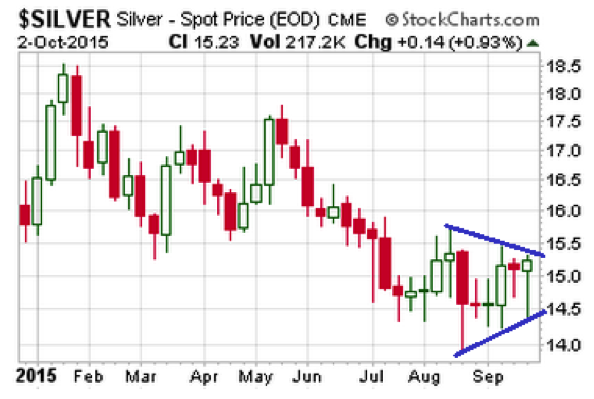
Silver spot prices haven’t been affected – at least not yet. The white metal spent most of the third quarter trading within a $14.50 – $15.50 range.

However, the weekly silver chart now shows an interesting wedge pattern developing. Silver prices briefly touched the bottom of the wedge last week before closing near the top. A solid weekly close above $15.50 would represent a bullish upside breakout, while a decisive break below $14.50 would carry bearish near-term implications.
Paper-traded spot markets can go in any direction in the near-term, so predictions about when breakouts will occur are, at best, educated guesses. Long-term investors should stay focused on the supply/demand fundamentals that make silver a compelling value. Price will eventually reflect value.
Nevertheless, long-term investors can look for opportune times to add to their positions.
Buying when an upside breakout shows up on the charts, in the early stages of a rally, gives you the ability to ride some momentum before prices get overextended.
Bullion.Directory or anyone involved with Bullion.Directory will not accept any liability for loss or damage as a result of reliance on the information including data, quotes, charts and buy/sell signals contained within this website. Please be fully informed regarding the risks and costs associated with trading in precious metals. Bullion.Directory advises you to always consult with a qualified and registered specialist advisor before investing in precious metals.


Leave a Reply