

If you have that strange feeling like the full story about the U.S. economy isn’t being told, you’re not the only one.
 Bullion.Directory precious metals analysis 15 July, 2024
By Peter Reagan
Financial Market Strategist at Birch Gold Group
In fact, in this piece we’re going to explore several examples that illustrate just how the American public is being sold one version of the economic story, while being left in the dark about the rest of the story.
According to some economists, the part that’s left out points towards the possibility that the United States has been suffering through varying degrees of an economic depression since 2021.

So with all of that in mind, let’s get started…
“Consequences Long into the Future”
If the United States economy has been worse off than officials are reporting, including the possibility of entering a depression, it might have started with the COVID panic.
In fact, a piece written by Jeffrey Tucker and Peter St. Onge at the Brownstone Institute summarized what was likely the start of the economic upheaval we’ve all been feeling:
We are used to this kind of language blaming the pandemic for the results of lockdowns. Of course, it was a man-made decision to turn a respiratory virus into an excuse to shut down the world. The lockdowns blew up all economic data, generating seesawing graphs on every indicator never seen in industrial history. They also made before/after comparison extremely difficult.
The consequences will echo long into the future. The high interest rates are a result of trying to slow down the money spigot unleashed in March 2020, in which more than $6 trillion in new cash appeared out of nowhere and was distributed as if by helicopter.
Keep in mind, just because some traditional assets might be going up right now, doesn’t mean the economy is healthy.
The same Brownstone piece also put a spotlight on a part of the story that keeps challenging the narrative that “things are alright”: persistent inflation.
To calculate whether and to what extent we are in recession, we look not at nominal GDP but real GDP; that is, adjusted for inflation. Two down quarters are considered recessionary. What if we adjust pathetic and seriously mis-estimated output numbers by a realistic understanding of inflation over the last few years?
We don’t have the numbers but a back-of-the-envelope suggests that we never left the recession of March 2020 and that everything has been getting gradually worse.
To further confirm what the two economists at Brownstone are getting at, the U.S. has already had back-to-back quarters of “down GDP” in early 2022. That should have been enough to signal that a recession was underway.
You can see those two negative quarters on the official line graph below, and also take note of how the real GDP “recovery” appears to be evaporating fast (source):
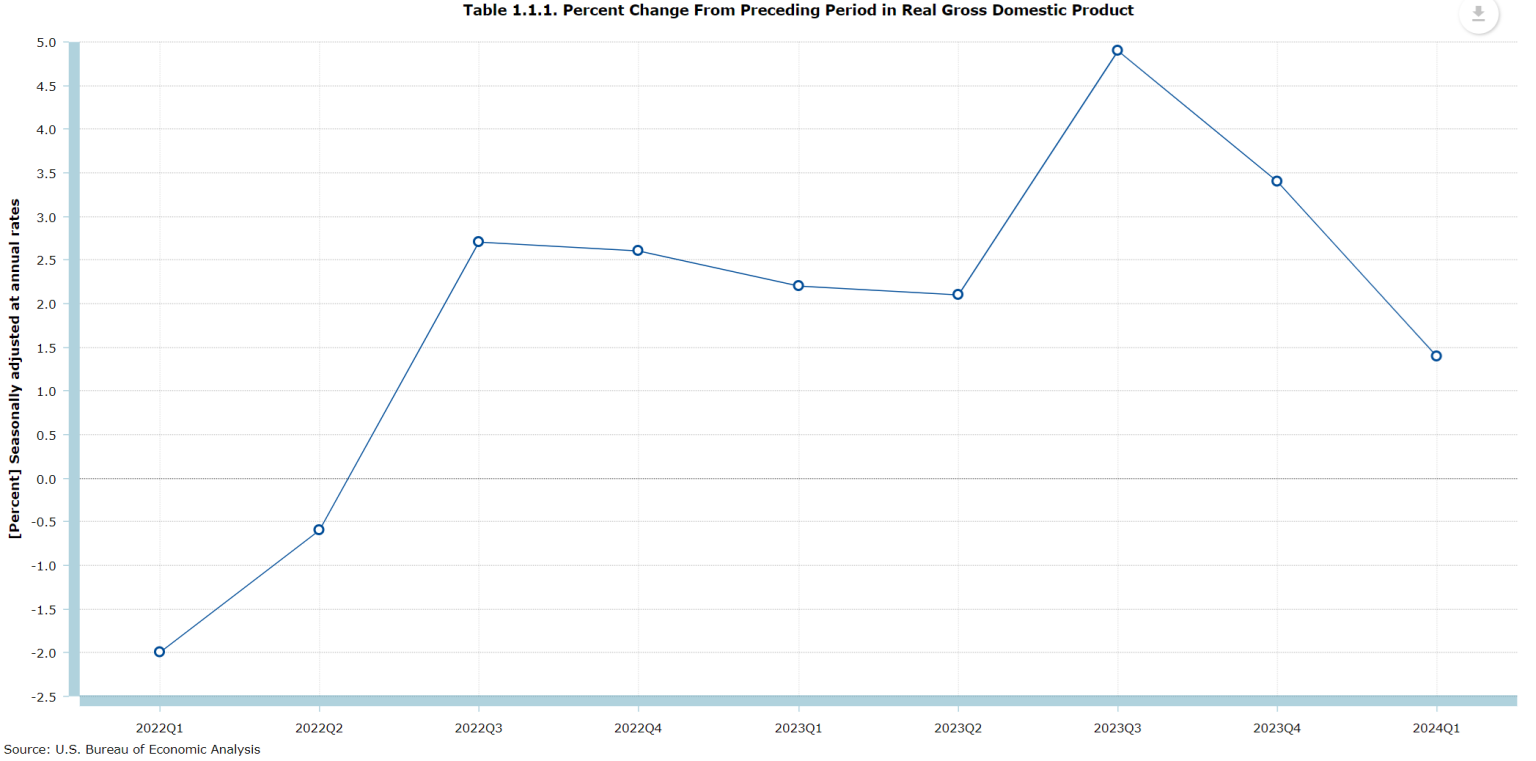
But keep in mind, there’s also a big difference between GDP and prosperity.
Namely that GDP is a measure of spending, while prosperity factors in how that spending is happening in the economy (Are people prosperous?).
Here’s a big hint: Consumers are racking up credit cards with inflated interest rates at record levels to prop up the current GDP by also paying inflated prices.
So the GDP is obviously unhealthy. But it also isn’t the only bit of data that doesn’t add up…
Thanks to a study conducted by the National Bureau of Economic Research (NBER), we can feel pretty certain that inflation hasn’t been accurately reported by officials since the pandemic started, either.
One graph from that study illustrates this point perfectly. It revealed that the price inflation rate was actually closer to 17% at its peak, once you include housing costs like mortgage payments.
It was still close to 7% as late as November 2023, take a look (yellow line):
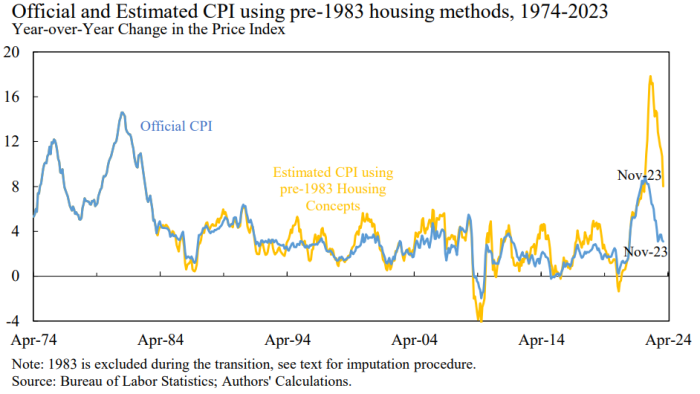
The yellow line on the graph above appears to represent a more accurate way to portray the full inflationary story, not just the parts that the Fed likes to report. We’ve actually written about “real” inflation before.
Next, let’s take a look at a few more data points…
Economic Slowdown Since 2021?
Since 1970, every recession was preceded by a slowdown in year-over-year industrial production.
There was only one exception to this rule shortly after Trump was elected to his first term, where the slowdown happened but a recession did not follow (source):
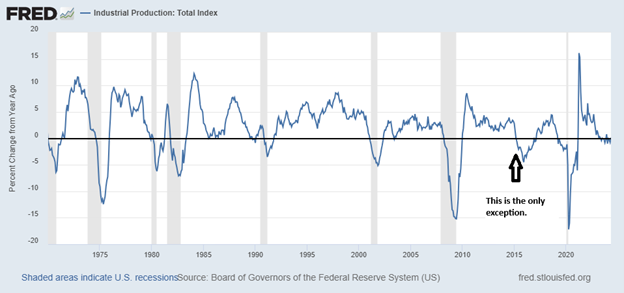
As you can see on the graph above, since 2021 year-over-year U.S. industrial production has been experiencing a rapid slowdown.
Retail sales aren’t what they’re cracked up to be, either. On the graph below, provided by E.J. Antoni on “X,” you can see two lines.
The green line represents retail sales. The blue line represents retail sales after they’re adjusted for inflation (source):
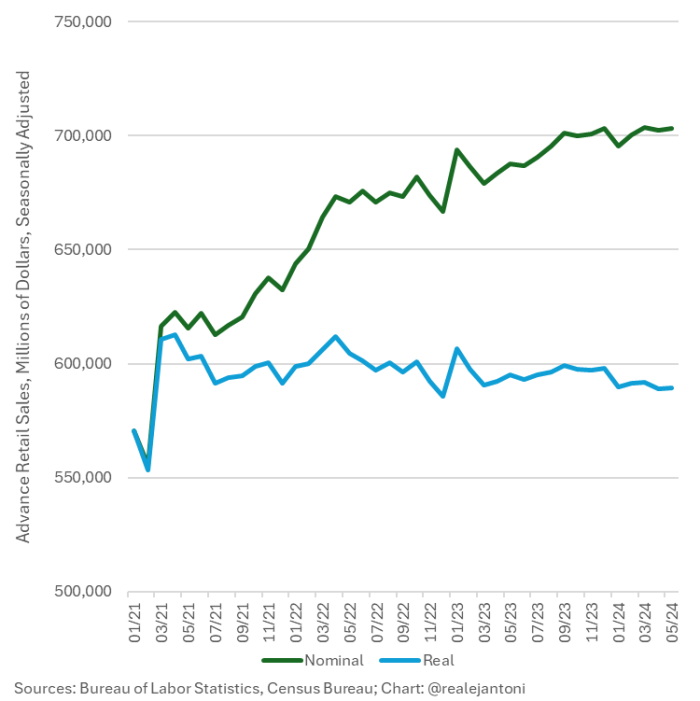
Retail sales don’t look like they’ve gained much traction since 2021. In fact, it looks like they’ve actually trended slightly downward since then.
Factory orders tell a similar story. E. J. Antoni summed up everything in a different post on “X”:
This is factory orders before and after adjusting for inflation: what looks like a 21.1% increase from Jan ’21 to Mar ’24 is only a 1.8% increase – the rest is just higher prices, not more physical stuff; worse yet, real orders are down 6.9% since their highwater mark in June ’22:
If the economy were “booming” like the corporate media and Biden keep repeating (ad nauseum), then the line graph below would look much different than it does:
In reality, once inflation has been factored in (the bright green line), part of the fantasy concocted by mainstream journalists disappears. So if you’re feeling like things are actually worse than they are officially reported, you’re probably right.
As for the possibility that the U.S. has been suffering through a depression, Peter St. Onge summarized his basic thesis in a recent article:
My base case has been that we’re repeating the 1970’s disaster driven by out of control government spending and out of control Fed money printing. The official numbers are matching that almost to a tee.
We’ll have to wait and see how things play out to be sure. The data appears like it’s pointing in that direction, though.
But here’s the deal: If Peter is right, then Americans could be in a lot of trouble in the near future. The financial suffering that we’ve all gone through over the last four years could be just the tip of the iceberg.
So much for Biden’s economic recovery.
But there’s also some good news…
Over And Over Again: Physical Gold Proves Its Value
Gold prices over the recent four-year period have had their normal ups and downs, but the overall price trend has been rather impressive.
Starting in March 2021, the gold price was $1721.89. The price in July 2024 is over $2400 as of this writing. So if you were to do the math, that’s a 37% increase over President Biden’s first term in office.
Not bad for a historically proven hedge against the price inflation that has ravaged the savings of many Americans over the same time period.
We’ve devoted an entire education page to gold and other inflation-resistant investments right here.That way, you can take a few minutes and learn about the benefits of each one.
By making the right moves now, you also have an opportunity to put yourself in a potentially better financial position for the future.
That would happen through proper diversification of your retirement dollars into assets that could help you preserve as much buying power as possible.
Peter Reagan

Peter Reagan is a financial market strategist at Birch Gold Group, one of America’s leading precious metals dealers, specializing in providing gold IRAs and retirement-focused precious metals portfolios.
Peter’s in-depth analysis and commentary is published across major investment portals, news channels, popular US conservative websites and most frequently on Birch Gold Group’s own website.
This article was originally published here


Leave a Reply