In technical analysis, much as in life, sometimes the most elegant solution turns out to be the simplest
 Bullion.Directory precious metals analysis 27 January, 2015
By Terry Kinder
Investor, Technical Analyst

“If the ladder is not leaning against the right wall, every step we take just gets us to the wrong place faster.” – Stephen Covey Image: pixabay
It’s a lot of fun to go through a bunch of charts, see how they relate and use them to get a better idea about the future price and momentum of gold.
However, technical analysts sometimes lose the forest for the trees.
In creating all of those charts, drawing all those support and resistance lines, pouring over technical indicators, it’s easy to forget that often the simplest explanation is also the best.
In this post I’ll offer a very simple view of the gold price and explain why I made the one and only choice I had to make before plotting one simple element on the chart.
If the ladder is not leaning against the right wall, every step we take just gets us to the wrong place faster.
One of the fundamental truths about technical analysis is that if you don’t start at the right point you’ll reach the wrong conclusion. Let me show you what I mean.
Originally, I had intended to write a post assembling a fairly good number of U.S. Dollar and gold charts. It would be another chartapalooza with a twist.
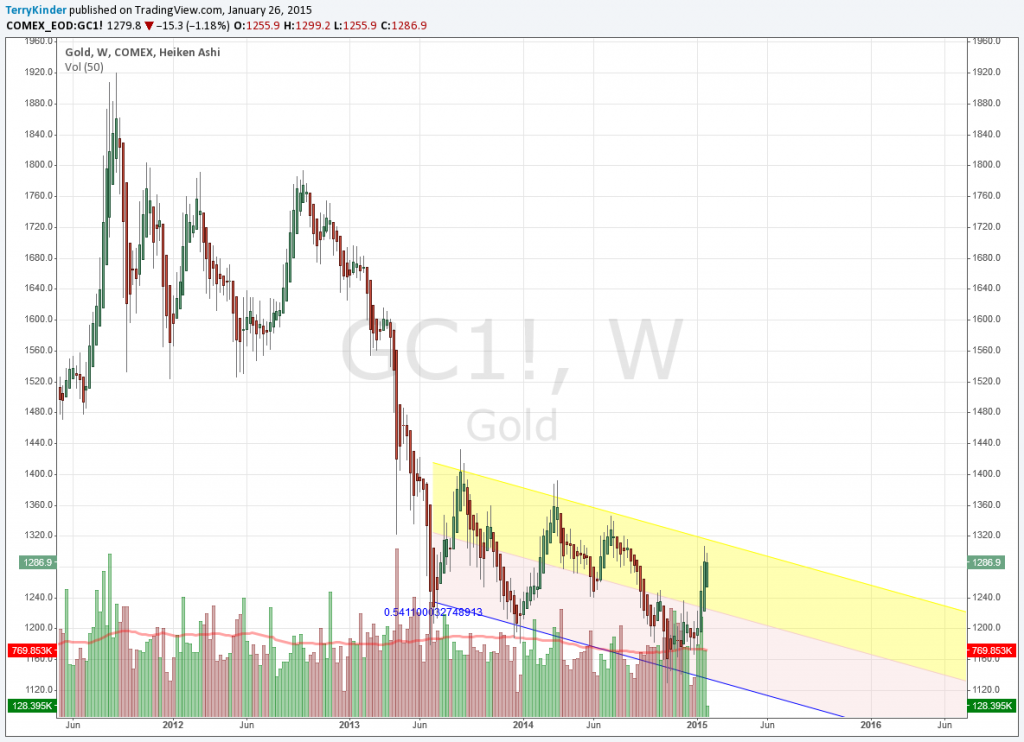
The chart above was created this morning in between doing some stock market research and was going to be used in that post.
When I drew the pink and yellow shaded regression channel on the chart above what struck me was its simplicity. To a chartist, strange beings that we are, it is a thing of beauty. It needs little explanation because what it is saying is so clear – gold is currently in a descending price channel.
It’s an uncomplicated picture. No trend lines. No additional channels. No technical indicators. The only reason the volume information was left on was because I didn’t think to remove it earlier. The gold price has several touches on both the top and bottom of the channel. I would prefer it had a few more, but the touches are more than sufficient to say gold is trading within a descending price channel.
So, now the question becomes why is the channel drawn the way it’s drawn? Again, the answer is simple. The price drop from the week of 10-1-2012 to the week of 6-13-2013 was the largest in terms of dollars since the gold price topped in 2011. In technical terms, the week of 6-13-2013 is the important pivot low. Gold fell nearly 35% in an 8-month period.
Sure, I could have drawn any series of channels from any series of points. But, the logical point to draw any channel from is the pivot low of 6-13-2013.
You have to begin at the correct point in order to reach the correct conclusion. Objectively, you begin at the most significant pivot high or low. If there is some reason this can’t be done, or that the chartist believes it shouldn’t be done, then the chart has to be plotted from some other obviously important point on the chart.
In this case, I simply don’t see that significant other point which is as simple and obviously important as the 6-13-2013 pivot low.
In technical analysis, the simplest solution is generally the best solution. By using the most significant turning points on the chart, the chartist avoids letting bias interfere with objectivity.
Prefer complexity? Check out the excellent analysis, “Gold & Silver Trading Alert: Is the Rally in Gold Over?” from Sunshine Profits.
Bullion.Directory or anyone involved with Bullion.Directory will not accept any liability for loss or damage as a result of reliance on the information including data, quotes, charts and buy/sell signals contained within this website. Please be fully informed regarding the risks and costs associated with trading in precious metals. Bullion.Directory advises you to always consult with a qualified and registered specialist advisor before investing in precious metals.


 Material provided on the Bullion.Directory website is strictly for informational purposes only. The content is developed from sources believed to be providing accurate information. No information on this website is intended as investment, tax or legal advice and must not be relied upon as such. Please consult legal or tax professionals for specific information regarding your individual situation. Precious metals carry risk and investors requiring advice should always consult a properly qualified advisor. Bullion.Directory, it's staff or affiliates do not accept any liability for loss, damages, or loss of profit resulting from readers investment decisions.
